

60
3 Non-geometry standards
• «Interface»
• «Type»
• «Control»
• «Entity»
• «Boundary»
• «Enumeration»
• «Exception»
• «MetaClass»
• «DataType»
The ISOfTS 19103 introduces two new stereotypes for use in geomatics.
«CodeList» is a list of potential and known values. An example is the list of
curve interpolations in ISO 19107 (Spatial schema) {linear, geodesie, circular
Arc3Points, etc.}. A «CodeList» is similar to an enumeration in that one of a
number of values is possible, but each differs in intent as a code list may be expanded over time.
«Leat» is a package that contains no sub-packages, only object classes and interface definitions.
Example for an UML c/ass-diagram of a small GIS
The purpose of this example is to clarifY the use of UML class-diagrams in the
context of geographie information.
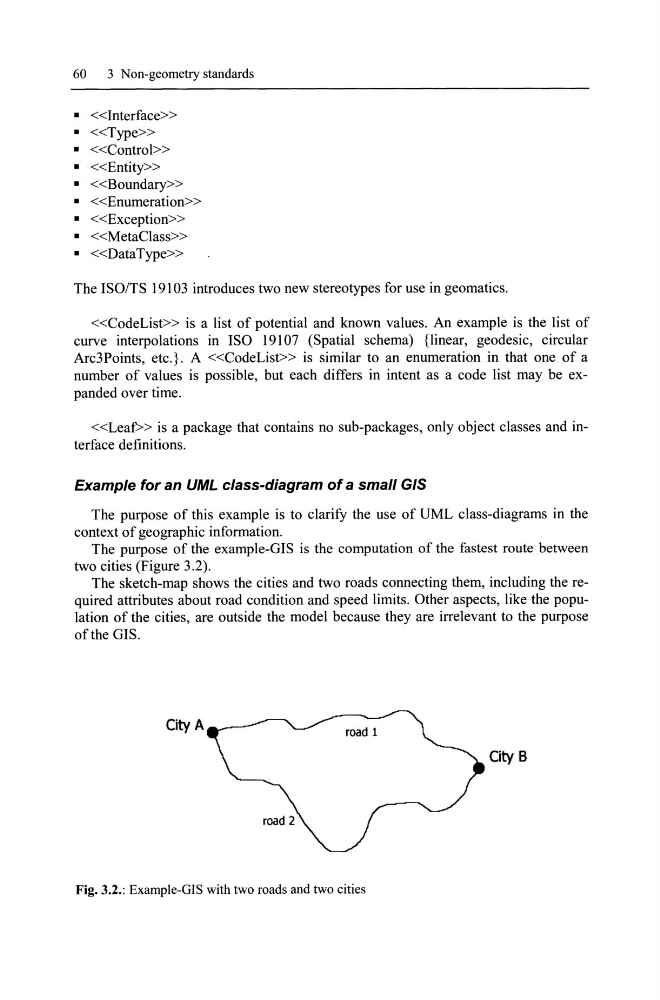
The purpose of the example-GIS is the computation of the fastest route between
two cities (Figure 3.2).
The sketch-map shows the cities and two roads connecting them, including the required attributes about road condition and speed limits. Other aspects, like the population of the cities, are outside the model because they are irrelevant to the purpose
ofthe GIS.
CityA
City B
Fig. 3.2.: Example-GIS with two roads and two cities
3 Non-geometry standards
• «Interface»
• «Type»
• «Control»
• «Entity»
• «Boundary»
• «Enumeration»
• «Exception»
• «MetaClass»
• «DataType»
The ISOfTS 19103 introduces two new stereotypes for use in geomatics.
«CodeList» is a list of potential and known values. An example is the list of
curve interpolations in ISO 19107 (Spatial schema) {linear, geodesie, circular
Arc3Points, etc.}. A «CodeList» is similar to an enumeration in that one of a
number of values is possible, but each differs in intent as a code list may be expanded over time.
«Leat» is a package that contains no sub-packages, only object classes and interface definitions.
Example for an UML c/ass-diagram of a small GIS
The purpose of this example is to clarifY the use of UML class-diagrams in the
context of geographie information.
The purpose of the example-GIS is the computation of the fastest route between
two cities (Figure 3.2).
The sketch-map shows the cities and two roads connecting them, including the required attributes about road condition and speed limits. Other aspects, like the population of the cities, are outside the model because they are irrelevant to the purpose
ofthe GIS.
CityA
City B
Fig. 3.2.: Example-GIS with two roads and two cities