

GIS for the Study of Beach Morphodynamics
183
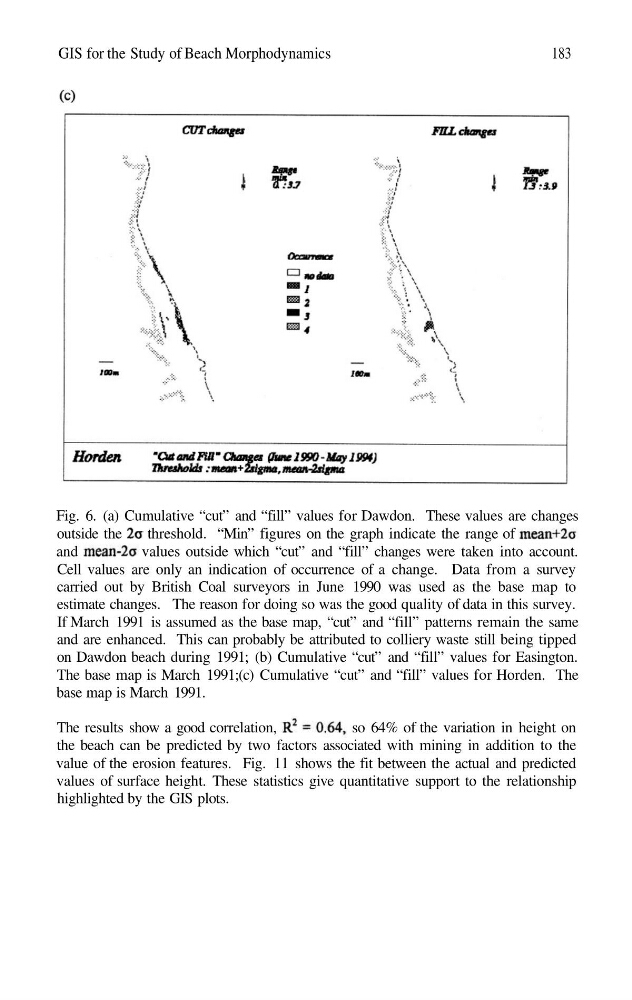
Fig. 6. (a) Cumulative “cut” and “fill” values for Dawdon. These values are changes
outside the
threshold. “Min” figures on the graph indicate the range of
and
values outside which “cut” and “fill” changes were taken into account.
Cell values are only an indication of occurrence of a change. Data from a survey
carried out by British Coal surveyors in June 1990 was used as the base map to
estimate changes. The reason for doing so was the good quality of data in this survey.
If March 1991 is assumed as the base map, “cut” and “fill” patterns remain the same
and are enhanced. This can probably be attributed to colliery waste still being tipped
on Dawdon beach during 1991; (b) Cumulative “cut” and “fill” values for Easington.
The base map is March 1991;(c) Cumulative “cut” and “fill” values for Horden. The
base map is March 1991.
The results show a good correlation,
so 64% of the variation in height on
the beach can be predicted by two factors associated with mining in addition to the
value of the erosion features. Fig. 11 shows the fit between the actual and predicted
values of surface height. These statistics give quantitative support to the relationship
highlighted by the GIS plots.
183
Fig. 6. (a) Cumulative “cut” and “fill” values for Dawdon. These values are changes
outside the
threshold. “Min” figures on the graph indicate the range of
and
values outside which “cut” and “fill” changes were taken into account.
Cell values are only an indication of occurrence of a change. Data from a survey
carried out by British Coal surveyors in June 1990 was used as the base map to
estimate changes. The reason for doing so was the good quality of data in this survey.
If March 1991 is assumed as the base map, “cut” and “fill” patterns remain the same
and are enhanced. This can probably be attributed to colliery waste still being tipped
on Dawdon beach during 1991; (b) Cumulative “cut” and “fill” values for Easington.
The base map is March 1991;(c) Cumulative “cut” and “fill” values for Horden. The
base map is March 1991.
The results show a good correlation,
so 64% of the variation in height on
the beach can be predicted by two factors associated with mining in addition to the
value of the erosion features. Fig. 11 shows the fit between the actual and predicted
values of surface height. These statistics give quantitative support to the relationship
highlighted by the GIS plots.