

24
Air Pollution and Turbulence: Modeling and Applications
detecting its backscattering and refl ections, are becoming commercially available for
routine measurements (not only for scientifi c research). Their advantages related to
the rawinsoundings are due to the availability of continuous measurements, but their
disadvantages are the costs (still expensive) and the quality data software. There are
few equipments being used nowadays, and it is a problem to choose the installations properly (for instance, SODAR is not effi cient at noisy environments like edges
of highways or urban areas). Figure 2.10 shows 36 h wind measurements, and it is
600
550
500
450
400
350
300
250
200
150
100
50
0
292
294
296
298
300
302
K
(m)
05;51hl
06;55hl
07;56hl
h = 220 m
FIGURE 2.9 Example of a profi le of tethered balloon at tropical forest during experiment
LBA/TRMM 1999.
(a)
(b)
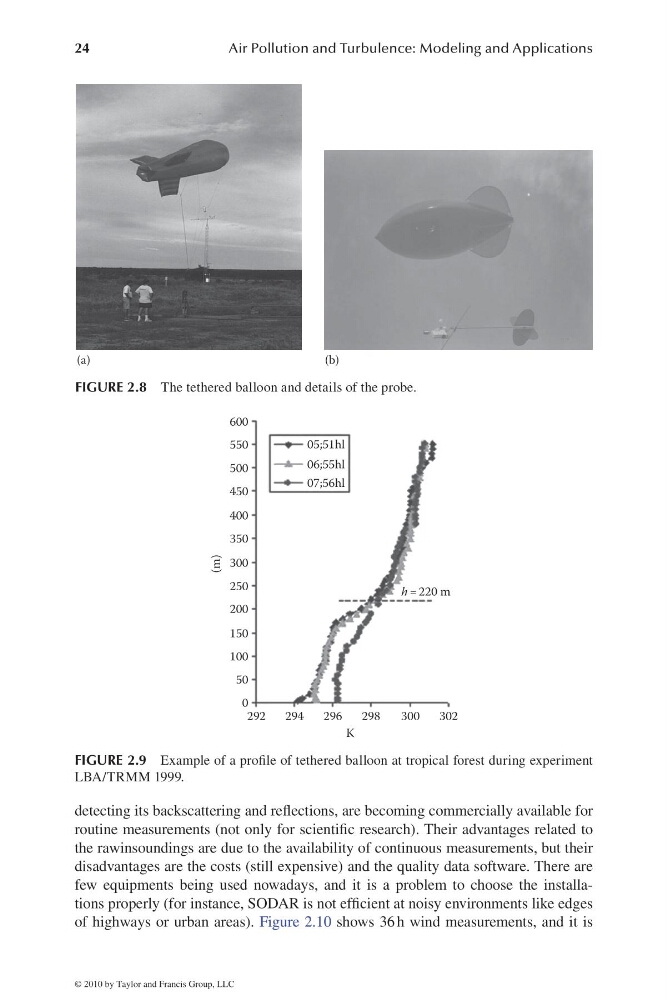
FIGURE 2.8 The tethered balloon and details of the probe.
© 2010 by Taylor and Francis Group, LLC
Air Pollution and Turbulence: Modeling and Applications
detecting its backscattering and refl ections, are becoming commercially available for
routine measurements (not only for scientifi c research). Their advantages related to
the rawinsoundings are due to the availability of continuous measurements, but their
disadvantages are the costs (still expensive) and the quality data software. There are
few equipments being used nowadays, and it is a problem to choose the installations properly (for instance, SODAR is not effi cient at noisy environments like edges
of highways or urban areas). Figure 2.10 shows 36 h wind measurements, and it is
600
550
500
450
400
350
300
250
200
150
100
50
0
292
294
296
298
300
302
K
(m)
05;51hl
06;55hl
07;56hl
h = 220 m
FIGURE 2.9 Example of a profi le of tethered balloon at tropical forest during experiment
LBA/TRMM 1999.
(a)
(b)
FIGURE 2.8 The tethered balloon and details of the probe.
© 2010 by Taylor and Francis Group, LLC