

Photochemical Air Pollution Modeling
277
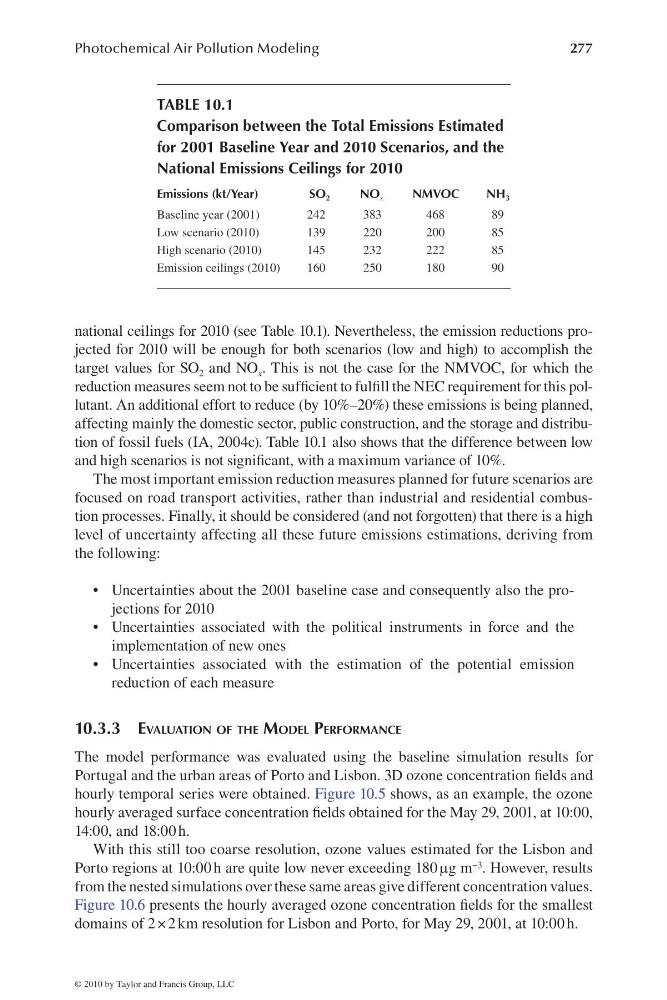
national ceilings for 2010 (see Table 10.1). Nevertheless, the emission reductions projected for 2010 will be enough for both scenarios (low and high) to accomplish the
target values for SO 2 and NO x . This is not the case for the NMVOC, for which the
reduction measures seem not to be suffi cient to fulfi ll the NEC requirement for this pollutant. An additional effort to reduce (by 10%–20%) these emissions is being planned,
affecting mainly the domestic sector, public construction, and the storage and distribution of fossil fuels (IA, 2004c). Table 10.1 also shows that the difference between low
and high scenarios is not signifi cant, with a maximum variance of 10%.
The most important emission reduction measures planned for future scenarios are
focused on road transport activities, rather than industrial and residential combustion processes. Finally, it should be considered (and not forgotten) that there is a high
level of uncertainty affecting all these future emissions estimations, deriving from
the following:
Uncertainties about the 2001 baseline case and consequently also the pro•
jections for 2010
Uncertainties associated with the political instruments in force and the
•
implementation of new ones
Uncertainties associated with the estimation of the potential emission
•
reduction of each measure
10.3.3 EVALUATION OF THE MODEL PERFORMANCE
The model performance was evaluated using the baseline simulation results for
Portugal and the urban areas of Porto and Lisbon. 3D ozone concentration fi elds and
hourly temporal series were obtained. Figure 10.5 shows, as an example, the ozone
hourly averaged surface concentration fi elds obtained for the May 29, 2001, at 10:00,
14:00, and 18:00 h.
With this still too coarse resolution, ozone values estimated for the Lisbon and
Porto regions at 10:00 h are quite low never exceeding 180 mg m −3 . However, results
from the nested simulations over these same areas give different concentration values.
Figure 10.6 presents the hourly averaged ozone concentration fi elds for the smallest
domains of 2 × 2 km resolution for Lisbon and Porto, for May 29, 2001, at 10:00 h.
TABLE 10.1
Comparison between the Total Emissions Estimated
for 2001 Baseline Year and 2010 Scenarios, and the
National Emissions Ceilings for 2010
Emissions (kt/Year)
SO 2
NO x
NMVOC
NH 3
Baseline year (2001)
242
383
468
89
Low scenario (2010)
139
220
200
85
High scenario (2010)
145
232
222
85
Emission ceilings (2010)
160
250
180
90
© 2010 by Taylor and Francis Group, LLC
277
national ceilings for 2010 (see Table 10.1). Nevertheless, the emission reductions projected for 2010 will be enough for both scenarios (low and high) to accomplish the
target values for SO 2 and NO x . This is not the case for the NMVOC, for which the
reduction measures seem not to be suffi cient to fulfi ll the NEC requirement for this pollutant. An additional effort to reduce (by 10%–20%) these emissions is being planned,
affecting mainly the domestic sector, public construction, and the storage and distribution of fossil fuels (IA, 2004c). Table 10.1 also shows that the difference between low
and high scenarios is not signifi cant, with a maximum variance of 10%.
The most important emission reduction measures planned for future scenarios are
focused on road transport activities, rather than industrial and residential combustion processes. Finally, it should be considered (and not forgotten) that there is a high
level of uncertainty affecting all these future emissions estimations, deriving from
the following:
Uncertainties about the 2001 baseline case and consequently also the pro•
jections for 2010
Uncertainties associated with the political instruments in force and the
•
implementation of new ones
Uncertainties associated with the estimation of the potential emission
•
reduction of each measure
10.3.3 EVALUATION OF THE MODEL PERFORMANCE
The model performance was evaluated using the baseline simulation results for
Portugal and the urban areas of Porto and Lisbon. 3D ozone concentration fi elds and
hourly temporal series were obtained. Figure 10.5 shows, as an example, the ozone
hourly averaged surface concentration fi elds obtained for the May 29, 2001, at 10:00,
14:00, and 18:00 h.
With this still too coarse resolution, ozone values estimated for the Lisbon and
Porto regions at 10:00 h are quite low never exceeding 180 mg m −3 . However, results
from the nested simulations over these same areas give different concentration values.
Figure 10.6 presents the hourly averaged ozone concentration fi elds for the smallest
domains of 2 × 2 km resolution for Lisbon and Porto, for May 29, 2001, at 10:00 h.
TABLE 10.1
Comparison between the Total Emissions Estimated
for 2001 Baseline Year and 2010 Scenarios, and the
National Emissions Ceilings for 2010
Emissions (kt/Year)
SO 2
NO x
NMVOC
NH 3
Baseline year (2001)
242
383
468
89
Low scenario (2010)
139
220
200
85
High scenario (2010)
145
232
222
85
Emission ceilings (2010)
160
250
180
90
© 2010 by Taylor and Francis Group, LLC