

276
Air Pollution and Turbulence: Modeling and Applications
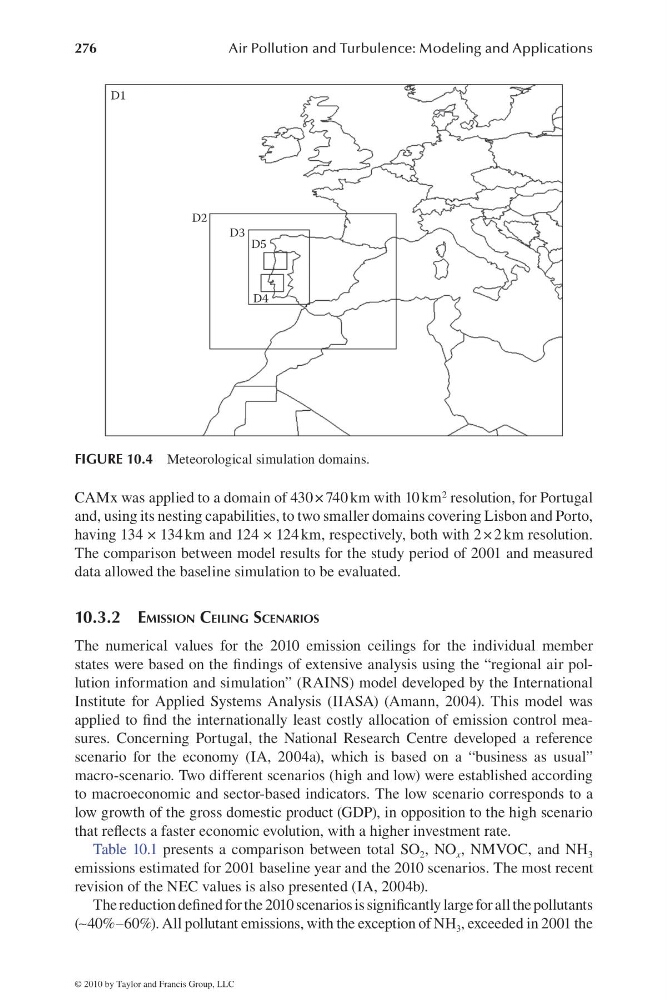
CAMx was applied to a domain of 430 × 740 km with 10 km 2 resolution, for Portugal
and, using its nesting capabilities, to two smaller domains covering Lisbon and Porto,
having 134 × 134 km and 124 × 124 km, respectively, both with 2 × 2 km resolution.
The comparison between model results for the study period of 2001 and measured
data allowed the baseline simulation to be evaluated.
10.3.2 EMISSION CEILING SCENARIOS
The numerical values for the 2010 emission ceilings for the individual member
states were based on the fi ndings of extensive analysis using the “regional air pollution information and simulation” (RAINS) model developed by the International
Institute for Applied Systems Analysis (IIASA) (Amann, 2004). This model was
applied to fi nd the internationally least costly allocation of emission control measures. Concerning Portugal, the National Research Centre developed a reference
scenario for the economy (IA, 2004a), which is based on a “business as usual”
macro-scenario. Two different scenarios (high and low) were established according
to macroeconomic and sector-based indicators. The low scenario corresponds to a
low growth of the gross domestic product (GDP), in opposition to the high scenario
that refl ects a faster economic evolution, with a higher investment rate.
Table 10.1 presents a comparison between total SO 2 , NO x , NMVOC, and NH 3
emissions estimated for 2001 baseline year and the 2010 scenarios. The most recent
revision of the NEC values is also presented (IA, 2004b).
The reduction defi ned for the 2010 scenarios is signifi cantly large for all the pollutants
(∼40%–60%). All pollutant emissions, with the exception of NH 3 , exceeded in 2001 the
D2
D3
D5
D4
D1
FIGURE 10.4 Meteorological simulation domains.
© 2010 by Taylor and Francis Group, LLC
Air Pollution and Turbulence: Modeling and Applications
CAMx was applied to a domain of 430 × 740 km with 10 km 2 resolution, for Portugal
and, using its nesting capabilities, to two smaller domains covering Lisbon and Porto,
having 134 × 134 km and 124 × 124 km, respectively, both with 2 × 2 km resolution.
The comparison between model results for the study period of 2001 and measured
data allowed the baseline simulation to be evaluated.
10.3.2 EMISSION CEILING SCENARIOS
The numerical values for the 2010 emission ceilings for the individual member
states were based on the fi ndings of extensive analysis using the “regional air pollution information and simulation” (RAINS) model developed by the International
Institute for Applied Systems Analysis (IIASA) (Amann, 2004). This model was
applied to fi nd the internationally least costly allocation of emission control measures. Concerning Portugal, the National Research Centre developed a reference
scenario for the economy (IA, 2004a), which is based on a “business as usual”
macro-scenario. Two different scenarios (high and low) were established according
to macroeconomic and sector-based indicators. The low scenario corresponds to a
low growth of the gross domestic product (GDP), in opposition to the high scenario
that refl ects a faster economic evolution, with a higher investment rate.
Table 10.1 presents a comparison between total SO 2 , NO x , NMVOC, and NH 3
emissions estimated for 2001 baseline year and the 2010 scenarios. The most recent
revision of the NEC values is also presented (IA, 2004b).
The reduction defi ned for the 2010 scenarios is signifi cantly large for all the pollutants
(∼40%–60%). All pollutant emissions, with the exception of NH 3 , exceeded in 2001 the
D2
D3
D5
D4
D1
FIGURE 10.4 Meteorological simulation domains.
© 2010 by Taylor and Francis Group, LLC