

260
Air Pollution and Turbulence: Modeling and Applications
9.4.2.1.1 Lagrangian Simulations and Pair Dispersion Statistics
To investigate the pair-dispersion statistics from the initial time t = 6τ * (corresponding to the PBL quasi-stationary regime), we integrated, in parallel with the LES, the
equation for the passive tracer trajectories defi ned by
=
d ( )
( ( ), )
d
n
i
n
i
i
x t
u x t t
t
(9.31)
where ( )
n
i
x t is the vector position of the ith-particle of the nth-couple at time t. The
velocity fi eld necessary to integrate this last equation, ( ( ), )
n
i
i
u x t t , was obtained by
means of a bilinear interpolation from the eight nearest grid points for which the
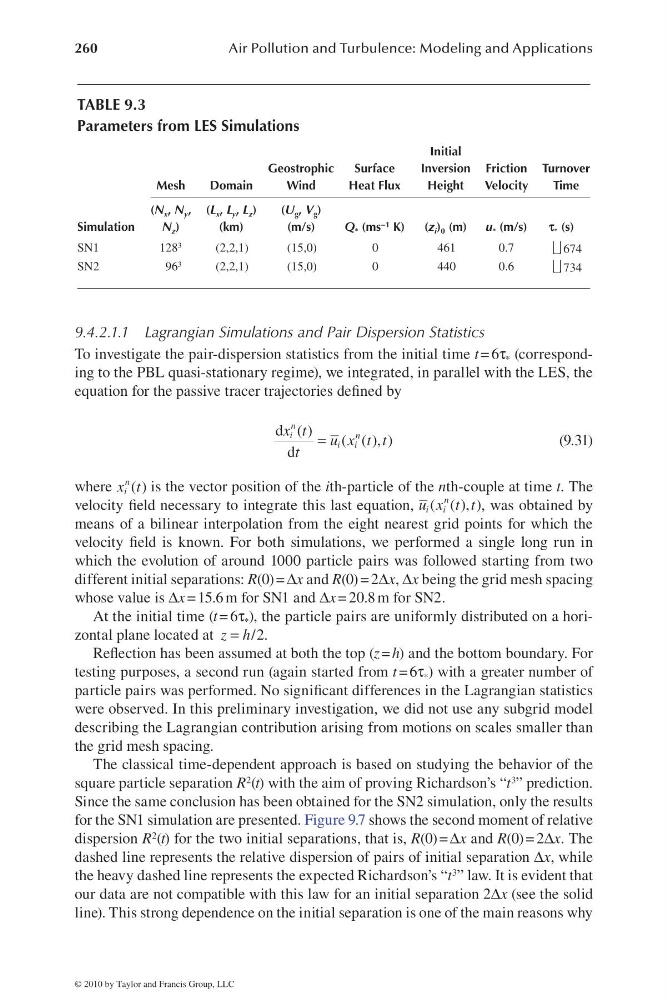
velocity fi eld is known. For both simulations, we performed a single long run in
which the evolution of around 1000 particle pairs was followed starting from two
different initial separations: R(0) = Δx and R(0) = 2Δx, Δx being the grid mesh spacing
whose value is Δx = 15.6 m for SN1 and Δx = 20.8 m for SN2.
At the initial time (t = 6τ * ), the particle pairs are uniformly distributed on a horizontal plane located at
/2.
z h
=
Refl ection has been assumed at both the top (z = h) and the bottom boundary. For
testing purposes, a second run (again started from t = 6τ * ) with a greater number of
particle pairs was performed. No signifi cant differences in the Lagrangian statistics
were observed. In this preliminary investigation, we did not use any subgrid model
describing the Lagrangian contribution arising from motions on scales smaller than
the grid mesh spacing.
The classical time-dependent approach is based on studying the behavior of the
square particle separation R 2 (t) with the aim of proving Richardson’s “t 3 ” prediction.
Since the same conclusion has been obtained for the SN2 simulation, only the results
for the SN1 simulation are presented. Figure 9.7 shows the second moment of relative
dispersion R 2 (t) for the two initial separations, that is, R(0) = Δx and R(0) = 2Δx. The
dashed line represents the relative dispersion of pairs of initial separation Δx, while
the heavy dashed line represents the expected Richardson’s “t 3 ” law. It is evident that
our data are not compatible with this law for an initial separation 2Δx (see the solid
line). This strong dependence on the initial separation is one of the main reasons why
TABLE 9.3
Parameters from LES Simulations
Mesh
Domain
Geostrophic
Wind
Surface
Heat Flux
Initial
Inversion
Height
Friction
Velocity
Turnover
Time
Simulation
(N x , N y ,
N z )
(L x , L y , L z )
(km)
(U g , V g )
(m/s)
Q * (ms −1 K)
(z i ) 0 (m)
u * (m/s)
t * (s)
SN1
128 3
(2,2,1)
(15,0)
0
461
0.7
⎣⎦ 674
SN2
96 3
(2,2,1)
(15,0)
0
440
0.6
⎣⎦ 734
© 2010 by Taylor and Francis Group, LLC
Air Pollution and Turbulence: Modeling and Applications
9.4.2.1.1 Lagrangian Simulations and Pair Dispersion Statistics
To investigate the pair-dispersion statistics from the initial time t = 6τ * (corresponding to the PBL quasi-stationary regime), we integrated, in parallel with the LES, the
equation for the passive tracer trajectories defi ned by
=
d ( )
( ( ), )
d
n
i
n
i
i
x t
u x t t
t
(9.31)
where ( )
n
i
x t is the vector position of the ith-particle of the nth-couple at time t. The
velocity fi eld necessary to integrate this last equation, ( ( ), )
n
i
i
u x t t , was obtained by
means of a bilinear interpolation from the eight nearest grid points for which the
velocity fi eld is known. For both simulations, we performed a single long run in
which the evolution of around 1000 particle pairs was followed starting from two
different initial separations: R(0) = Δx and R(0) = 2Δx, Δx being the grid mesh spacing
whose value is Δx = 15.6 m for SN1 and Δx = 20.8 m for SN2.
At the initial time (t = 6τ * ), the particle pairs are uniformly distributed on a horizontal plane located at
/2.
z h
=
Refl ection has been assumed at both the top (z = h) and the bottom boundary. For
testing purposes, a second run (again started from t = 6τ * ) with a greater number of
particle pairs was performed. No signifi cant differences in the Lagrangian statistics
were observed. In this preliminary investigation, we did not use any subgrid model
describing the Lagrangian contribution arising from motions on scales smaller than
the grid mesh spacing.
The classical time-dependent approach is based on studying the behavior of the
square particle separation R 2 (t) with the aim of proving Richardson’s “t 3 ” prediction.
Since the same conclusion has been obtained for the SN2 simulation, only the results
for the SN1 simulation are presented. Figure 9.7 shows the second moment of relative
dispersion R 2 (t) for the two initial separations, that is, R(0) = Δx and R(0) = 2Δx. The
dashed line represents the relative dispersion of pairs of initial separation Δx, while
the heavy dashed line represents the expected Richardson’s “t 3 ” law. It is evident that
our data are not compatible with this law for an initial separation 2Δx (see the solid
line). This strong dependence on the initial separation is one of the main reasons why
TABLE 9.3
Parameters from LES Simulations
Mesh
Domain
Geostrophic
Wind
Surface
Heat Flux
Initial
Inversion
Height
Friction
Velocity
Turnover
Time
Simulation
(N x , N y ,
N z )
(L x , L y , L z )
(km)
(U g , V g )
(m/s)
Q * (ms −1 K)
(z i ) 0 (m)
u * (m/s)
t * (s)
SN1
128 3
(2,2,1)
(15,0)
0
461
0.7
⎣⎦ 674
SN2
96 3
(2,2,1)
(15,0)
0
440
0.6
⎣⎦ 734
© 2010 by Taylor and Francis Group, LLC