

264
C. R. Krishna Murti and T. S. S. Dilcshith
VI
..
."
U
U
::J:
~
CD
..
25.0 -rx c:
a.
.s~
. .
..
~o
.r.
20.0
UI ..
5
~~
. .
-
M
15.0 -
I~~
0
S!
0
U1
:E
x
0
0
0
u
c:
£
>
a
UI
10.0 - I-0
. . a.
:E
a
0
..
c:
c; . . c:
.E
E
a
::J:
5.0 -
c; a. . .
~
."
U1
~
~
i. c: .. 0 OJ
W
~
c:
c:
1.0 -
~
c:
a
0
ell
0
."
UI
a
c:
..
."
. .
..
:>
'E
0
."
O.B
c;
.E
. .
E
u. 0
a u
."
.~
:>
-
.r. .r.
.E
UI
."
UI
Qj
a.
. a.
0
c:
0.6 -
UI
c:
U1
.r.
..
0
E
..
0
;:
0
a. ~
U
.r. ~
.r. 0
c;
0.4 -
0
Il.
a. 0
c:
-.j
. .
c:
",'
:>
..
h..N
0
.r.
0.2 -
~
0.1 -
I I I
0
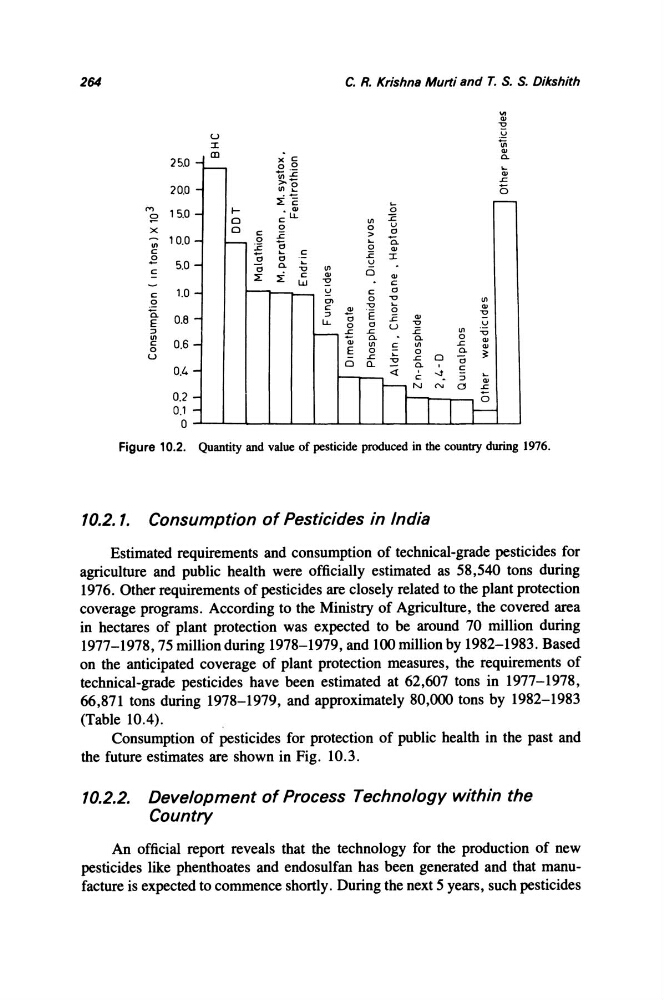
Figure 10.2. Quantity and value of pesticide produced in the country during 1976.
10.2. 1. Consumption of Pesticides in India
Estimated requirements and consumption of technical-grade pesticides for
agriculture and public health were officially estimated as 58,540 tons during
1976. Other requirements of pesticides are closely related to the plant protection
coverage programs. According to the Ministry of Agriculture, the covered area
in hectares of plant protection was expected to be around 70 million during
1977-1978,75 million during 1978-1979, and 100 million by 1982-1983. Based
on the anticipated coverage of plant protection measures, the requirements of
technical-grade pesticides have been estimated at 62,607 tons in 1977-1978,
66,871 tons during 1978-1979, and approximately 80,000 tons by 1982-1983
(Table 10.4).
Consumption of pesticides for protection of public health in the past and
the future estimates are shown in Fig. 10.3.
10.2.2. Development of Process Technology within the
Country
An official report reveals that the technology for the production of new
pesticides like phenthoates and endosulfan has been generated and that manufacture is expected to commence shortly. During the next 5 years, such pesticides
C. R. Krishna Murti and T. S. S. Dilcshith
VI
..
."
U
U
::J:
~
CD
..
25.0 -rx c:
a.
.s~
. .
..
~o
.r.
20.0
UI ..
5
~~
. .
-
M
15.0 -
I~~
0
S!
0
U1
:E
x
0
0
0
u
c:
£
>
a
UI
10.0 - I-0
. . a.
:E
a
0
..
c:
c; . . c:
.E
E
a
::J:
5.0 -
c; a. . .
~
."
U1
~
~
i. c: .. 0 OJ
W
~
c:
c:
1.0 -
~
c:
a
0
ell
0
."
UI
a
c:
..
."
. .
..
:>
'E
0
."
O.B
c;
.E
. .
E
u. 0
a u
."
.~
:>
-
.r. .r.
.E
UI
."
UI
Qj
a.
. a.
0
c:
0.6 -
UI
c:
U1
.r.
..
0
E
..
0
;:
0
a. ~
U
.r. ~
.r. 0
c;
0.4 -
0
Il.
a. 0
c:
-.j
. .
c:
",'
:>
..
h..N
0
.r.
0.2 -
~
0.1 -
I I I
0
Figure 10.2. Quantity and value of pesticide produced in the country during 1976.
10.2. 1. Consumption of Pesticides in India
Estimated requirements and consumption of technical-grade pesticides for
agriculture and public health were officially estimated as 58,540 tons during
1976. Other requirements of pesticides are closely related to the plant protection
coverage programs. According to the Ministry of Agriculture, the covered area
in hectares of plant protection was expected to be around 70 million during
1977-1978,75 million during 1978-1979, and 100 million by 1982-1983. Based
on the anticipated coverage of plant protection measures, the requirements of
technical-grade pesticides have been estimated at 62,607 tons in 1977-1978,
66,871 tons during 1978-1979, and approximately 80,000 tons by 1982-1983
(Table 10.4).
Consumption of pesticides for protection of public health in the past and
the future estimates are shown in Fig. 10.3.
10.2.2. Development of Process Technology within the
Country
An official report reveals that the technology for the production of new
pesticides like phenthoates and endosulfan has been generated and that manufacture is expected to commence shortly. During the next 5 years, such pesticides