

260
C. R. Krishna Murti and T. S. S. Dikshith
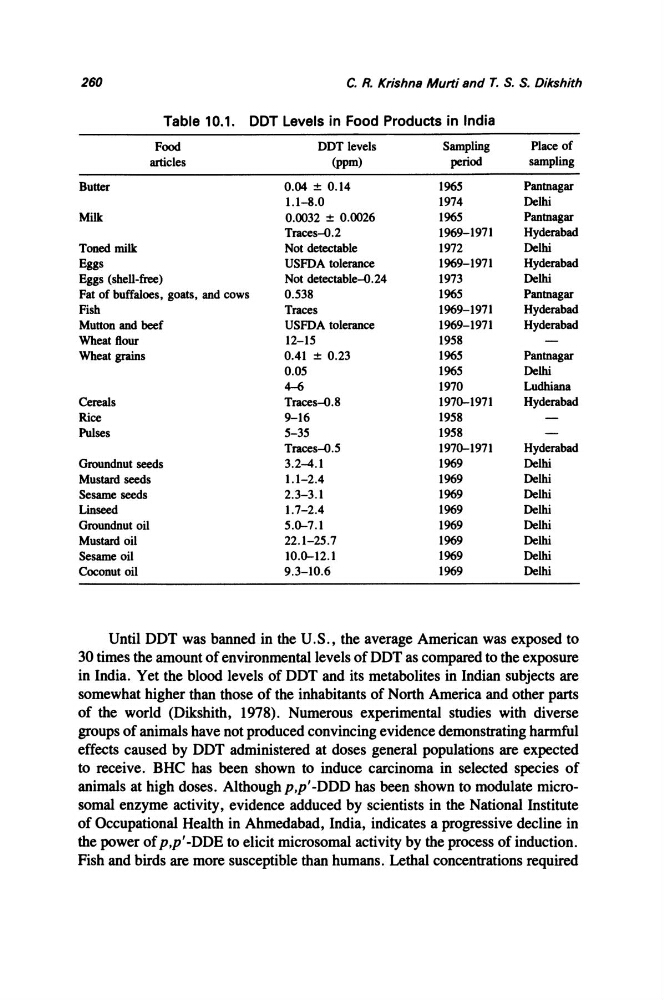
Table 10.1. DDT Levels in Food Products in India
Food
DDT levels
Sampling
Place of
articles
(ppm)
period
sampling
Butter
0.04 ± 0.14
1965
Pantnagar
1.1-8.0
1974
Delhi
Milk
0.0032 ± 0.0026
1965
Pantnagar
Traces--O.2
1969-1971
Hyderabad
Toned milk
Not detectable
1972
Delhi
Eggs
USFDA tolerance
1969-1971
Hyderabad
Eggs (shell-free)
Not detectable~.24
1973
Delhi
Fat of buffaloes, goats, and cows
0.538
1965
Pantnagar
Fish
Traces
1969-1971
Hyderabad
Mutton and beef
USFDA tolerance
1969-1971
Hyderabad
Wheat flour
12-15
1958
Wheat grains
0.41 ± 0.23
1965
Pantnagar
0.05
1965
Delhi
4-6
1970
Ludhiana
Cereals
Traces~.8
1970-1971
Hyderabad
Rice
9-16
1958
Pulses
5-35
1958
Traces~.5
1970-1971
Hyderabad
Groundnut seeds
3.2-4.1
1969
Delhi
Mustard seeds
1.1-2.4
1969
Delhi
Sesame seeds
2.3-3.1
1969
Delhi
Linseed
1.7-2.4
1969
Delhi
Groundnutoil
5.0-7.1
1969
Delhi
Mustard oil
22.1-25.7
1969
Delhi
Sesame oil
10.0-12.1
1969
Delhi
Coconut oil
9.3-10.6
1969
Delhi
Until DDT was banned in the U.S., the average American was exposed to
30 times the amount of environmental levels of DDT as compared to the exposure
in India. Yet the blood levels of DDT and its metabolites in Indian subjects are
somewhat higher than those of the inhabitants of North America and other parts
of the world (Dikshith, 1978). Numerous experimental studies with diverse
groups of animals have not produced convincing evidence demonstrating harmful
effects caused by DDT administered at doses general populations are expected
to receive. BHC has been shown to induce carcinoma in selected species of
animals at high doses. Although p,p' -DOD has been shown to modulate microsomal enzyme activity, evidence adduced by scientists in the National Institute
of Occupational Health in Ahmedabad, India, indicates a progressive decline in
the power of p,p' -DOE to elicit microsomal activity by the process of induction.
Fish and birds are more susceptible than humans. Lethal concentrations required
C. R. Krishna Murti and T. S. S. Dikshith
Table 10.1. DDT Levels in Food Products in India
Food
DDT levels
Sampling
Place of
articles
(ppm)
period
sampling
Butter
0.04 ± 0.14
1965
Pantnagar
1.1-8.0
1974
Delhi
Milk
0.0032 ± 0.0026
1965
Pantnagar
Traces--O.2
1969-1971
Hyderabad
Toned milk
Not detectable
1972
Delhi
Eggs
USFDA tolerance
1969-1971
Hyderabad
Eggs (shell-free)
Not detectable~.24
1973
Delhi
Fat of buffaloes, goats, and cows
0.538
1965
Pantnagar
Fish
Traces
1969-1971
Hyderabad
Mutton and beef
USFDA tolerance
1969-1971
Hyderabad
Wheat flour
12-15
1958
Wheat grains
0.41 ± 0.23
1965
Pantnagar
0.05
1965
Delhi
4-6
1970
Ludhiana
Cereals
Traces~.8
1970-1971
Hyderabad
Rice
9-16
1958
Pulses
5-35
1958
Traces~.5
1970-1971
Hyderabad
Groundnut seeds
3.2-4.1
1969
Delhi
Mustard seeds
1.1-2.4
1969
Delhi
Sesame seeds
2.3-3.1
1969
Delhi
Linseed
1.7-2.4
1969
Delhi
Groundnutoil
5.0-7.1
1969
Delhi
Mustard oil
22.1-25.7
1969
Delhi
Sesame oil
10.0-12.1
1969
Delhi
Coconut oil
9.3-10.6
1969
Delhi
Until DDT was banned in the U.S., the average American was exposed to
30 times the amount of environmental levels of DDT as compared to the exposure
in India. Yet the blood levels of DDT and its metabolites in Indian subjects are
somewhat higher than those of the inhabitants of North America and other parts
of the world (Dikshith, 1978). Numerous experimental studies with diverse
groups of animals have not produced convincing evidence demonstrating harmful
effects caused by DDT administered at doses general populations are expected
to receive. BHC has been shown to induce carcinoma in selected species of
animals at high doses. Although p,p' -DOD has been shown to modulate microsomal enzyme activity, evidence adduced by scientists in the National Institute
of Occupational Health in Ahmedabad, India, indicates a progressive decline in
the power of p,p' -DOE to elicit microsomal activity by the process of induction.
Fish and birds are more susceptible than humans. Lethal concentrations required