

Natural and Anthropogenic Mercury Sources
37
these anthropogenic emissions (Lindqvist et al. 1991). Whether the emitted Hg(o)
originates from parent geological materials or from past and recently deposited
atmospheric mercury, the net effect of these processes on the global mercury
cycle is the same: to increase the atmospheric mercury pool available for
redistribution and redeposition.
The global total atmospheric emission of mercury has been estimated to be in
the range 5000 to 15000 t year-I (Lindqvist et al. 1991; Fitzgerald 1996; Sukhenko
and Vasiliev 1996). The first quantitative worldwide estimate of the annual
industrial inputs of 16 elements to the environment including mercury has been
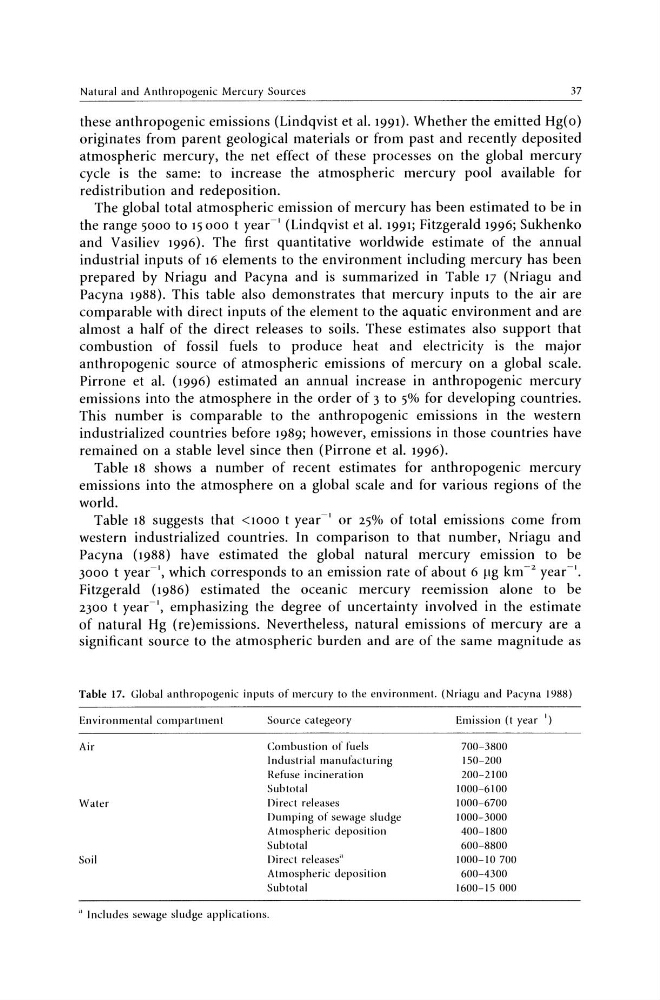
prepared by Nriagu and Pacyna and is summarized in Table 17 (Nriagu and
Pacyna 1988). This table also demonstrates that mercury inputs to the air are
comparable with direct inputs of the element to the aquatic environment and are
almost a half of the direct releases to soils. These estimates also support that
combustion of fossil fuels to produce heat and electricity is the major
anthropogenic source of atmospheric emissions of mercury on a global scale.
Pirrone et al. (1996) estimated an annual increase in anthropogenic mercury
emissions into the atmosphere in the order of 3 to 5% for developing countries.
This number is comparable to the anthropogenic emissions in the western
industrialized countries before 1989; however, emissions in those countries have
remained on a stable level since then (Pirrone et al. 1996).
Table 18 shows a number of recent estimates for anthropogenic mercury
emissions into the atmosphere on a global scale and for various regions of the
world.
Table 18 suggests that <1000 t year-lor 25% of total emissions come from
western industrialized countries. In comparison to that number, Nriagu and
Pacyna (1988) have estimated the global natural mercury emission to be
3000 t year-I, which corresponds to an emission rate of about 6 ~lg km- 2 year-I.
Fitzgerald (1986) estimated the oceanic mercury reemission alone to be
2300 t year-I, emphasizing the degree of uncertainty involved in the estimate
of natural Hg (re)emissions. Nevertheless, natural emissions of mercury are a
significant source to the atmospheric burden and are of the same magnitude as
Table 17. Global anthropogenic inputs of mercury to the environment. (Nriagu and Pacyna 1988)
Environmental compartment
Source categeory
Emission (t year ')
Air
Combustion of fuels
700-3800
Industrial manufacturing
150-200
Refuse incineration
200-2100
Subtotal
1000-6100
Water
Direct releases
1000-6700
Dumping of sewage sludge
1000-3000
Atmospheric deposition
400-1800
Subtotal
600-8800
Soil
Direct releases"
1000-10 700
Atmospheric deposition
600-4300
Subtotal
1600-15000
" Includes sewage sludge applications.
37
these anthropogenic emissions (Lindqvist et al. 1991). Whether the emitted Hg(o)
originates from parent geological materials or from past and recently deposited
atmospheric mercury, the net effect of these processes on the global mercury
cycle is the same: to increase the atmospheric mercury pool available for
redistribution and redeposition.
The global total atmospheric emission of mercury has been estimated to be in
the range 5000 to 15000 t year-I (Lindqvist et al. 1991; Fitzgerald 1996; Sukhenko
and Vasiliev 1996). The first quantitative worldwide estimate of the annual
industrial inputs of 16 elements to the environment including mercury has been
prepared by Nriagu and Pacyna and is summarized in Table 17 (Nriagu and
Pacyna 1988). This table also demonstrates that mercury inputs to the air are
comparable with direct inputs of the element to the aquatic environment and are
almost a half of the direct releases to soils. These estimates also support that
combustion of fossil fuels to produce heat and electricity is the major
anthropogenic source of atmospheric emissions of mercury on a global scale.
Pirrone et al. (1996) estimated an annual increase in anthropogenic mercury
emissions into the atmosphere in the order of 3 to 5% for developing countries.
This number is comparable to the anthropogenic emissions in the western
industrialized countries before 1989; however, emissions in those countries have
remained on a stable level since then (Pirrone et al. 1996).
Table 18 shows a number of recent estimates for anthropogenic mercury
emissions into the atmosphere on a global scale and for various regions of the
world.
Table 18 suggests that <1000 t year-lor 25% of total emissions come from
western industrialized countries. In comparison to that number, Nriagu and
Pacyna (1988) have estimated the global natural mercury emission to be
3000 t year-I, which corresponds to an emission rate of about 6 ~lg km- 2 year-I.
Fitzgerald (1986) estimated the oceanic mercury reemission alone to be
2300 t year-I, emphasizing the degree of uncertainty involved in the estimate
of natural Hg (re)emissions. Nevertheless, natural emissions of mercury are a
significant source to the atmospheric burden and are of the same magnitude as
Table 17. Global anthropogenic inputs of mercury to the environment. (Nriagu and Pacyna 1988)
Environmental compartment
Source categeory
Emission (t year ')
Air
Combustion of fuels
700-3800
Industrial manufacturing
150-200
Refuse incineration
200-2100
Subtotal
1000-6100
Water
Direct releases
1000-6700
Dumping of sewage sludge
1000-3000
Atmospheric deposition
400-1800
Subtotal
600-8800
Soil
Direct releases"
1000-10 700
Atmospheric deposition
600-4300
Subtotal
1600-15000
" Includes sewage sludge applications.