

Mercury Subsurface Maxima in Sediments
469
The results of a preliminary 1992 survey of sediment mercury concentrations
as a function of depth in three cores taken from the Thomson, Forbay, and Fond
du Lac Reservoirs show significant maxima in mercury levels (1 to 2 pg/g Hg) in
strata corresponding to major industrial discharges from wood-fiber processing
and paper-making (in Cloquet, Minnesota) between the 1940S and early 1960s,
see Fig. 3 (MPCA 1996). Other historical uses of mercury in the watershed may
have also contributed to the accumulated levels of mercury in the river sediments
(Table 1).
Although significant mercury concentration maxima in the three cores were
found relatively deep in the sediment strata (1-2, 0.5-0.75, and 2- 3 m for
Thomson, Forbay, and Fond du Lac reservoirs, respectively), they were all taken
in the deeper water portions of the reservoirs. Other areas of these reservoirs,
such as areas of higher currents or shallower water, may not have sediments with
the same characteristics. That is, the highly contaminated portion of the
sediment may be much nearer to the sediment-water interface as a result of
varying sedimentation rates and sediment redistribution during periods of high
flow, and thus may make an important contribution to mercury bioaccumulation
and fishery contamination.
The goal of this study was to identify mercury-contaminated sediment areas in
the lower St. Louis River that may be contributing to the existing fish and food
chain contamination. The contaminated sediment areas with potentially high
rates of mercury bioaccumulation in the fish food chain may become a priority
for developing mitigation efforts.
:)J)
-14UO
ft 1200
C
.: 1111111
2~ 45
"W;,;;,;(39";;;;' "-"- .---- - - -----------1
Cloquet to
Thomson
Brookston
Rescrvoi r
I ~ PSI~E!\M j
FDL
Reservoir
Chambers
Grove
I
Upper
Lowcr
EsuJlIry
Estuary
IDQWN~!R EA~ I
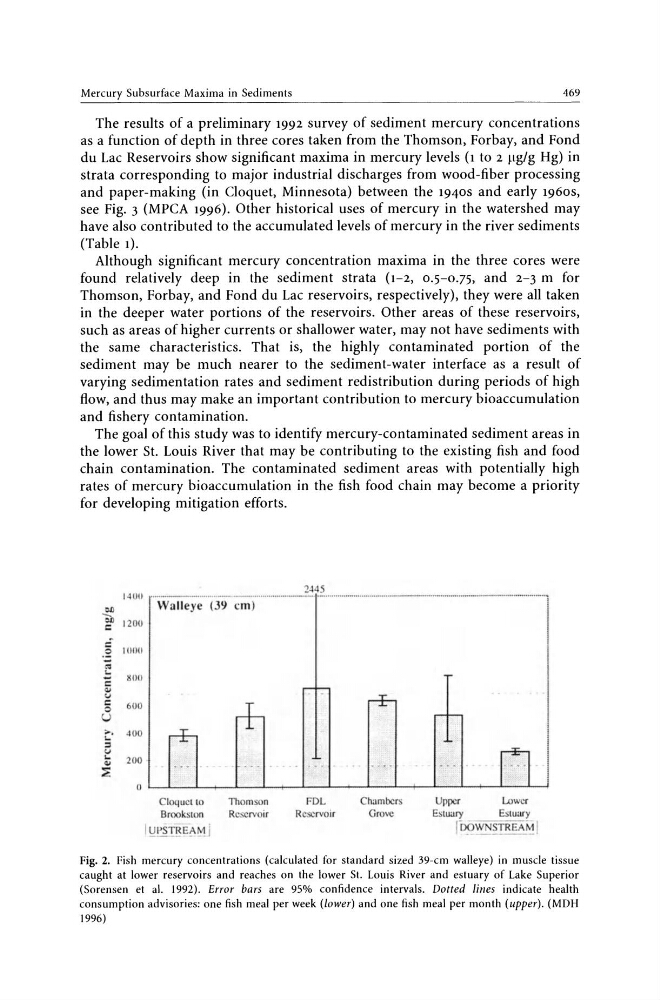
Fig. 2. Fish mercury concentrations (calculated for standard sized 39-cm walleye) in muscle tissue
caught at lower reservoirs and reaches on the lower SI. Louis River and estuary of Lake Superior
(Sorensen et al. 1992). Error bars are 95% confidence intervals. Dotted lines indicate health
consumption advisories: one fi sh meal per week (lower) and one fish meal per month (upper). (MDH
1996)
469
The results of a preliminary 1992 survey of sediment mercury concentrations
as a function of depth in three cores taken from the Thomson, Forbay, and Fond
du Lac Reservoirs show significant maxima in mercury levels (1 to 2 pg/g Hg) in
strata corresponding to major industrial discharges from wood-fiber processing
and paper-making (in Cloquet, Minnesota) between the 1940S and early 1960s,
see Fig. 3 (MPCA 1996). Other historical uses of mercury in the watershed may
have also contributed to the accumulated levels of mercury in the river sediments
(Table 1).
Although significant mercury concentration maxima in the three cores were
found relatively deep in the sediment strata (1-2, 0.5-0.75, and 2- 3 m for
Thomson, Forbay, and Fond du Lac reservoirs, respectively), they were all taken
in the deeper water portions of the reservoirs. Other areas of these reservoirs,
such as areas of higher currents or shallower water, may not have sediments with
the same characteristics. That is, the highly contaminated portion of the
sediment may be much nearer to the sediment-water interface as a result of
varying sedimentation rates and sediment redistribution during periods of high
flow, and thus may make an important contribution to mercury bioaccumulation
and fishery contamination.
The goal of this study was to identify mercury-contaminated sediment areas in
the lower St. Louis River that may be contributing to the existing fish and food
chain contamination. The contaminated sediment areas with potentially high
rates of mercury bioaccumulation in the fish food chain may become a priority
for developing mitigation efforts.
:)J)
-14UO
ft 1200
C
.: 1111111
2~ 45
"W;,;;,;(39";;;;' "-"- .---- - - -----------1
Cloquet to
Thomson
Brookston
Rescrvoi r
I ~ PSI~E!\M j
FDL
Reservoir
Chambers
Grove
I
Upper
Lowcr
EsuJlIry
Estuary
IDQWN~!R EA~ I
Fig. 2. Fish mercury concentrations (calculated for standard sized 39-cm walleye) in muscle tissue
caught at lower reservoirs and reaches on the lower SI. Louis River and estuary of Lake Superior
(Sorensen et al. 1992). Error bars are 95% confidence intervals. Dotted lines indicate health
consumption advisories: one fi sh meal per week (lower) and one fish meal per month (upper). (MDH
1996)