

414
Z. Spirit and M. Hraste
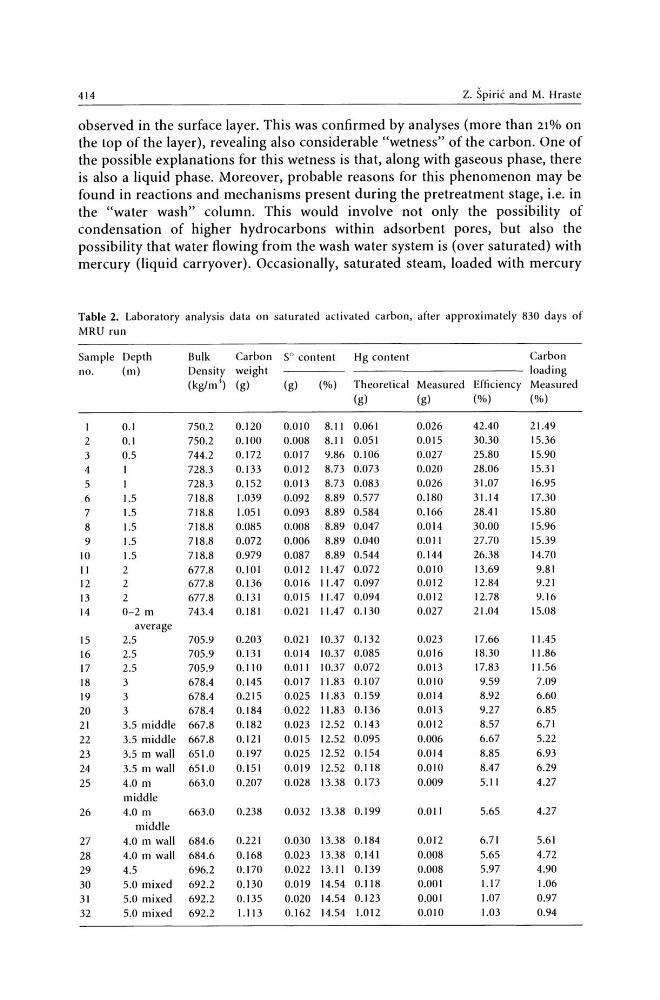
observed in the surface layer. This was confirmed by analyses (more than 21% on
the top of the layer), revealing also considerable "wetness" of the carbon. One of
the possible explanations for this wetness is that, along with gaseous phase, there
is also a liquid phase. Moreover, probable reasons for this phenomenon may be
found in reactions and mechanisms present during the pretreatment stage, i.e. in
the "water wash" column. This would involve not only the possibility of
condensation of higher hydrocarbons within adsorbent pores, but also the
possibility that water flowing from the wash water system is (over saturated) with
mercury (liquid carryover). Occasionally, saturated steam, loaded with mercury
Table 2. Laboratory analysis data on saturated activated carbon, after approximately 830 days of
MRU run
Sample Depth
Bulk
Carbon
Density weight
(kg/m') (g)
no.
(m)
1
2
3
4
5
6
7
8
9
10
II
12
13
14
15
16
17
IS
19
20
21
22
23
24
25
26
27
28
29
30
31
32
0.1
750.2
0.1
750.2
0.5
744.2
728.3
728.3
1.5
718.8
1.5
718.8
1.5
718.8
1.5
718.8
1.5
718.8
2
677.8
2
677.8
2
677.S
0-2 m
743.4
average
2.5
705.9
2.5
705.9
2.5
705.9
3
678.4
3
678.4
3
678.4
3.5 middle 667.8
3.5 middle 667.8
3.5 m wall 651.0
3.5 m wall 651.0
4.0 m
663.0
middle
4.0 m
663.0
middle
4.0 m wall 684.6
4.0 m wall 684.6
4.5
696.2
5.0 mixed 692.2
5.0 mixed
692.2
5.0 mixed
692.2
0.120
0.100
0.172
0.133
0.152
1.039
1.051
0.085
0.072
0.979
0.101
0.136
0.131
0.181
0.203
0.131
0.110
0.145
0.215
0.184
0.182
0.121
0.197
0.151
0.207
0.238
0.221
0.168
0.170
0.130
0.135
1.113
SO content
Hg content
Carbon
- - - - - - - - - - - - loading
(g)
('Yo)
Theoretical Measured Efficiency
(g)
(g)
('Yo)
0.010 8.11 0.061
0.008 8.11 0.051
0.017 9.86 0.106
0.012 8.73 0.073
0.013 8.73 0.083
0.092 8.89 0.577
0.093 8.89 0.584
0.008 8.89 0.047
0.006 8.89 0.040
0.087 8.89 0.544
0.012 11.47 0.072
0.016 11.47 0.097
0.015 11.47 0.094
0.021 11.47 0.130
0.021 10.37 0.132
0.014 10.37 0.085
0.011 10.37 0.072
0.017 II.S3 0.107
0.025 11.83 0.159
0.022 11.83 0.136
0.023 12.52 0.143
0.015 12.52 0.095
0.025 12.52 0.154
0.019 12.52 0.118
0.028 13.38 0.173
0.032 13.38 0.199
0.030 13.38 0.184
0.023 13.38 0.141
0.022 13.11 0.139
0.019 14.54 0.118
0.020 14.54 0.123
0.162 14.54 1.012
0.026
0.015
0.027
0.020
0.026
0.180
0.166
0.014
0.011
0.144
0.010
0.012
0.012
0.027
0.023
0.016
0.013
0.010
0.014
0.013
0.012
0.006
0.014
0.010
0.009
0.011
0.012
0.008
0.008
0.001
0.001
0.010
42.40
30.30
25.80
28.06
31.07
31.14
28.41
30.00
27.70
26.38
13.69
12.84
12.78
21.04
17.66
18.30
17.83
9.59
8.92
9.27
8.57
6.67
8.S5
8.47
5.11
5.65
6.71
5.65
5.97
1.17
1.07
1.03
Measured
('Yo)
21.49
15.36
15.90
15.31
16.95
17.30
15.80
15.96
15.39
14.70
9.81
9.21
9.16
15.08
11.45
11.86
11.56
7.09
6.60
6.85
6.71
5.22
6.93
6.29
4.27
4.27
5.61
4.72
4.90
1.06
0.97
0.94
Z. Spirit and M. Hraste
observed in the surface layer. This was confirmed by analyses (more than 21% on
the top of the layer), revealing also considerable "wetness" of the carbon. One of
the possible explanations for this wetness is that, along with gaseous phase, there
is also a liquid phase. Moreover, probable reasons for this phenomenon may be
found in reactions and mechanisms present during the pretreatment stage, i.e. in
the "water wash" column. This would involve not only the possibility of
condensation of higher hydrocarbons within adsorbent pores, but also the
possibility that water flowing from the wash water system is (over saturated) with
mercury (liquid carryover). Occasionally, saturated steam, loaded with mercury
Table 2. Laboratory analysis data on saturated activated carbon, after approximately 830 days of
MRU run
Sample Depth
Bulk
Carbon
Density weight
(kg/m') (g)
no.
(m)
1
2
3
4
5
6
7
8
9
10
II
12
13
14
15
16
17
IS
19
20
21
22
23
24
25
26
27
28
29
30
31
32
0.1
750.2
0.1
750.2
0.5
744.2
728.3
728.3
1.5
718.8
1.5
718.8
1.5
718.8
1.5
718.8
1.5
718.8
2
677.8
2
677.8
2
677.S
0-2 m
743.4
average
2.5
705.9
2.5
705.9
2.5
705.9
3
678.4
3
678.4
3
678.4
3.5 middle 667.8
3.5 middle 667.8
3.5 m wall 651.0
3.5 m wall 651.0
4.0 m
663.0
middle
4.0 m
663.0
middle
4.0 m wall 684.6
4.0 m wall 684.6
4.5
696.2
5.0 mixed 692.2
5.0 mixed
692.2
5.0 mixed
692.2
0.120
0.100
0.172
0.133
0.152
1.039
1.051
0.085
0.072
0.979
0.101
0.136
0.131
0.181
0.203
0.131
0.110
0.145
0.215
0.184
0.182
0.121
0.197
0.151
0.207
0.238
0.221
0.168
0.170
0.130
0.135
1.113
SO content
Hg content
Carbon
- - - - - - - - - - - - loading
(g)
('Yo)
Theoretical Measured Efficiency
(g)
(g)
('Yo)
0.010 8.11 0.061
0.008 8.11 0.051
0.017 9.86 0.106
0.012 8.73 0.073
0.013 8.73 0.083
0.092 8.89 0.577
0.093 8.89 0.584
0.008 8.89 0.047
0.006 8.89 0.040
0.087 8.89 0.544
0.012 11.47 0.072
0.016 11.47 0.097
0.015 11.47 0.094
0.021 11.47 0.130
0.021 10.37 0.132
0.014 10.37 0.085
0.011 10.37 0.072
0.017 II.S3 0.107
0.025 11.83 0.159
0.022 11.83 0.136
0.023 12.52 0.143
0.015 12.52 0.095
0.025 12.52 0.154
0.019 12.52 0.118
0.028 13.38 0.173
0.032 13.38 0.199
0.030 13.38 0.184
0.023 13.38 0.141
0.022 13.11 0.139
0.019 14.54 0.118
0.020 14.54 0.123
0.162 14.54 1.012
0.026
0.015
0.027
0.020
0.026
0.180
0.166
0.014
0.011
0.144
0.010
0.012
0.012
0.027
0.023
0.016
0.013
0.010
0.014
0.013
0.012
0.006
0.014
0.010
0.009
0.011
0.012
0.008
0.008
0.001
0.001
0.010
42.40
30.30
25.80
28.06
31.07
31.14
28.41
30.00
27.70
26.38
13.69
12.84
12.78
21.04
17.66
18.30
17.83
9.59
8.92
9.27
8.57
6.67
8.S5
8.47
5.11
5.65
6.71
5.65
5.97
1.17
1.07
1.03
Measured
('Yo)
21.49
15.36
15.90
15.31
16.95
17.30
15.80
15.96
15.39
14.70
9.81
9.21
9.16
15.08
11.45
11.86
11.56
7.09
6.60
6.85
6.71
5.22
6.93
6.29
4.27
4.27
5.61
4.72
4.90
1.06
0.97
0.94