

390
O. Kruger et al.
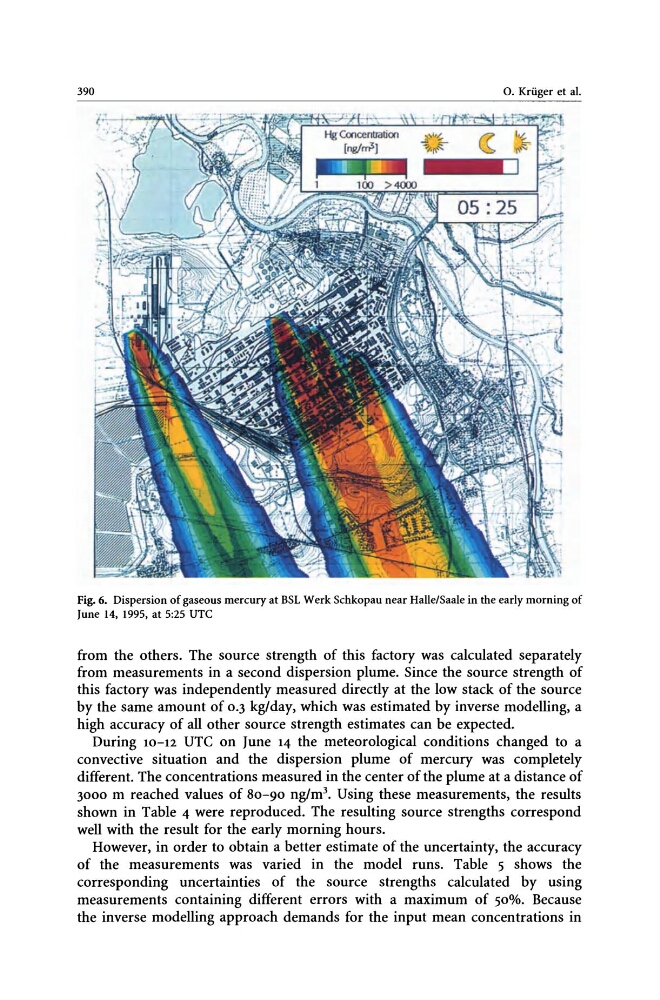
Fig. 6. Dispersion of gaseous mercury at BSL Werk Schkopau near Halle/Saale in the early morning of
June 14, 1995, at 5:25 UTe
from the others. The source strength of this factory was calculated separately
from measurements in a second dispersion plume. Since the source strength of
this factory was independently measured directly at the low stack of the source
by the same amount of 0 .3 kg/day, which was estimated by inverse modelling, a
high accuracy of all other source strength estimates can be expected.
During 10-12 UTe on June 14 the meteorological conditions changed to a
convective situation and the dispersion plume of mercury was completely
different. The concentrations measured in the center of the plume at a distance of
3000 m reached values of 80-90 ng/m3. Using these measurements, the results
shown in Table 4 were reproduced. The resulting source strengths correspond
well with the result for the early morning hours.
However, in order to obtain a better estimate of the uncertainty, the accuracy
of the measurements was varied in the model runs. Table 5 shows the
corresponding uncertainties of the source strengths calculated by using
measurements containing different errors with a maximum of 50%. Because
the inverse modelling approach demands for the input mean concentrations in
O. Kruger et al.
Fig. 6. Dispersion of gaseous mercury at BSL Werk Schkopau near Halle/Saale in the early morning of
June 14, 1995, at 5:25 UTe
from the others. The source strength of this factory was calculated separately
from measurements in a second dispersion plume. Since the source strength of
this factory was independently measured directly at the low stack of the source
by the same amount of 0 .3 kg/day, which was estimated by inverse modelling, a
high accuracy of all other source strength estimates can be expected.
During 10-12 UTe on June 14 the meteorological conditions changed to a
convective situation and the dispersion plume of mercury was completely
different. The concentrations measured in the center of the plume at a distance of
3000 m reached values of 80-90 ng/m3. Using these measurements, the results
shown in Table 4 were reproduced. The resulting source strengths correspond
well with the result for the early morning hours.
However, in order to obtain a better estimate of the uncertainty, the accuracy
of the measurements was varied in the model runs. Table 5 shows the
corresponding uncertainties of the source strengths calculated by using
measurements containing different errors with a maximum of 50%. Because
the inverse modelling approach demands for the input mean concentrations in