

Estimation of Gaseous Mercury Emissions in Germany
389
Within this period of time the highest concentrations of total gaseous mercury,
some 100 ng/m3, outside the factory premises were measured during the early
morning hours of June 14. These concentrations at the BSL Werk Schkopau,
which are relatively high compared to the background values, were exclusively
measured under extremely stable meteorological conditions near the center of
the dispersion plume. With regard to the application of the inverse modelling
procedure, it was expected that a higher accuracy can be attained in the emission
estimates if such peak concentrations are taken into account.
The dry deposition, in the model parameterized by a dry deposition velocity,
was assumed. following Petersen et al. (1995). Since gaseous mercury in the
atmosphere mainly occurs as elemental mercury (HgO) and to a small portion as
divalent inorganic mercury [Hg(II)(g)], an effective dry deposition velocity was
taken into account. For this effective dry deposition velocity the contribution of
Hgo was assumed to be negligibly small compared to Hg(II)(g) with a value
which was adopted to be 4 cm/s. Because the portion of divalent inorganic
mercury was unknown, three different portions of 0, 15 and 30 of this species
were considered for the inverse modelling runs. These portions correspond to
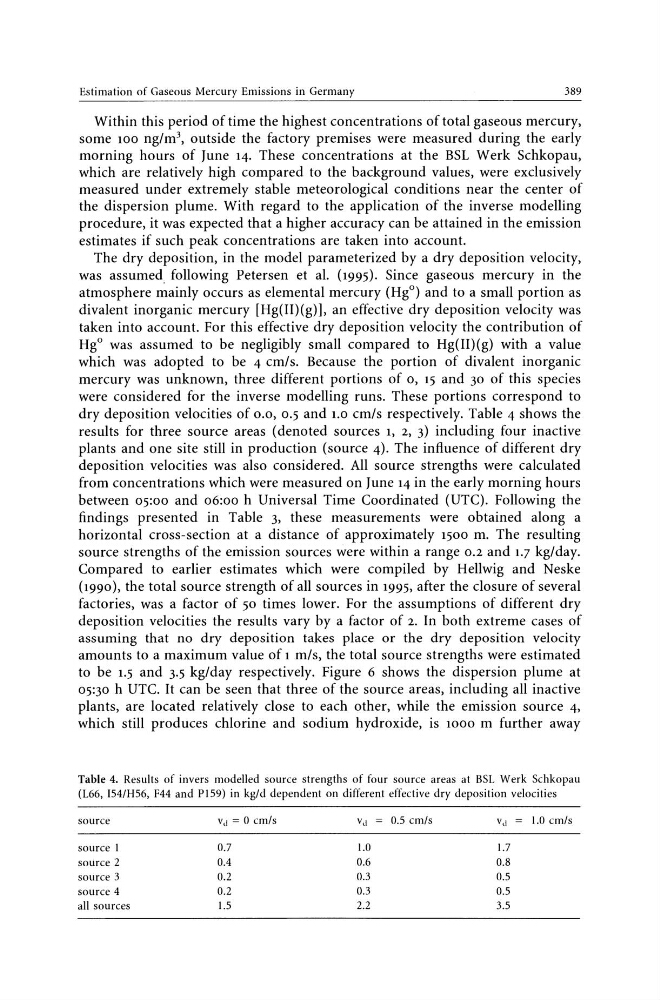
dry deposition velocities of 0.0, 0.5 and 1.0 cm/s respectively. Table 4 shows the
results for three source areas (denoted sources 1, 2, 3) including four inactive
plants and one site still in production (source 4). The influence of different dry
deposition velocities was also considered. All source strengths were calculated
from concentrations which were measured on June 14 in the early morning hours
between 05:00 and 06:00 h Universal Time Coordinated (UTC). Following the
findings presented in Table 3, these measurements were obtained along a
horizontal cross-section at a distance of approximately 1500 m. The resulting
source strengths of the emission sources were within a range 0.2 and 1.7 kg/day.
Compared to earlier estimates which were compiled by Hellwig and Neske
(1990), the total source strength of all sources in 1995, after the closure of several
factories, was a factor of 50 times lower. For the assumptions of different dry
deposition velocities the results vary by a factor of 2. In both extreme cases of
assuming that no dry deposition takes place or the dry deposition velocity
amounts to a maximum value of 1 mIs, the total source strengths were estimated
to be 1.5 and 3.5 kg/day respectively. Figure 6 shows the dispersion plume at
05:30 h UTC. It can be seen that three of the source areas, including all inactive
plants, are located relatively close to each other, while the emission source 4,
which still produces chlorine and sodium hydroxide, is 1000 m further away
Table 4. Results of invers modelled source strengths of four source areas at BSL Werk Schkopau
(L66, 154/H56, F44 and P159) in kg/d dependent on different effective dry deposition velocities
source
v" = 0 cmls
v" = 0.5 cmls
v" = 1.0 cmls
source 1
0.7
1.0
1.7
soUrce 2
0.4
0.6
0.8
source 3
0.2
0.3
0.5
source 4
0.2
0.3
0.5
all sources
1.5
2.2
3.5
389
Within this period of time the highest concentrations of total gaseous mercury,
some 100 ng/m3, outside the factory premises were measured during the early
morning hours of June 14. These concentrations at the BSL Werk Schkopau,
which are relatively high compared to the background values, were exclusively
measured under extremely stable meteorological conditions near the center of
the dispersion plume. With regard to the application of the inverse modelling
procedure, it was expected that a higher accuracy can be attained in the emission
estimates if such peak concentrations are taken into account.
The dry deposition, in the model parameterized by a dry deposition velocity,
was assumed. following Petersen et al. (1995). Since gaseous mercury in the
atmosphere mainly occurs as elemental mercury (HgO) and to a small portion as
divalent inorganic mercury [Hg(II)(g)], an effective dry deposition velocity was
taken into account. For this effective dry deposition velocity the contribution of
Hgo was assumed to be negligibly small compared to Hg(II)(g) with a value
which was adopted to be 4 cm/s. Because the portion of divalent inorganic
mercury was unknown, three different portions of 0, 15 and 30 of this species
were considered for the inverse modelling runs. These portions correspond to
dry deposition velocities of 0.0, 0.5 and 1.0 cm/s respectively. Table 4 shows the
results for three source areas (denoted sources 1, 2, 3) including four inactive
plants and one site still in production (source 4). The influence of different dry
deposition velocities was also considered. All source strengths were calculated
from concentrations which were measured on June 14 in the early morning hours
between 05:00 and 06:00 h Universal Time Coordinated (UTC). Following the
findings presented in Table 3, these measurements were obtained along a
horizontal cross-section at a distance of approximately 1500 m. The resulting
source strengths of the emission sources were within a range 0.2 and 1.7 kg/day.
Compared to earlier estimates which were compiled by Hellwig and Neske
(1990), the total source strength of all sources in 1995, after the closure of several
factories, was a factor of 50 times lower. For the assumptions of different dry
deposition velocities the results vary by a factor of 2. In both extreme cases of
assuming that no dry deposition takes place or the dry deposition velocity
amounts to a maximum value of 1 mIs, the total source strengths were estimated
to be 1.5 and 3.5 kg/day respectively. Figure 6 shows the dispersion plume at
05:30 h UTC. It can be seen that three of the source areas, including all inactive
plants, are located relatively close to each other, while the emission source 4,
which still produces chlorine and sodium hydroxide, is 1000 m further away
Table 4. Results of invers modelled source strengths of four source areas at BSL Werk Schkopau
(L66, 154/H56, F44 and P159) in kg/d dependent on different effective dry deposition velocities
source
v" = 0 cmls
v" = 0.5 cmls
v" = 1.0 cmls
source 1
0.7
1.0
1.7
soUrce 2
0.4
0.6
0.8
source 3
0.2
0.3
0.5
source 4
0.2
0.3
0.5
all sources
1.5
2.2
3.5