

382
O. Kruger et aI.
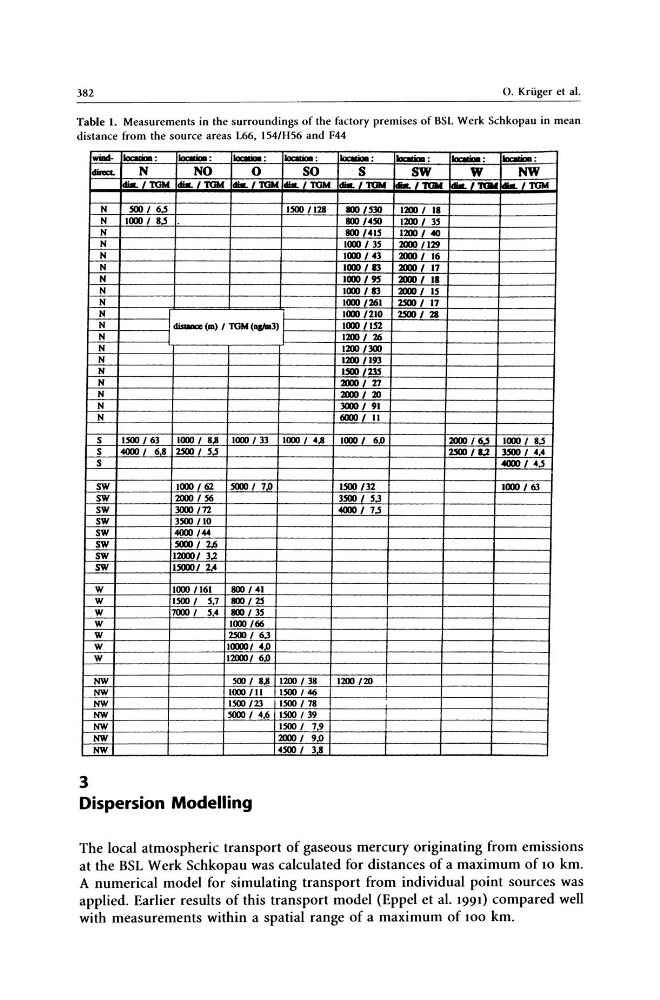
Table 1. Measurements in the surroundings of the factory premises of BSL Werk Schkopau in mean
distance from the source areas L66, 154/H56 and F44
wind- Ioc:aIioa :
Ioc:aIioa :
IoCIIioa :
IocaIioa :
IoCIIioa :
Ioc:aIioa :
Ioc:aIioa :
Ioc:IIioa :
diJecL
N
NO
0
SO
S
SW
W
NW
dilL I TOM dilL I TOM dilL I TOM dilL TOM dill. I TOM kIlL I TOM !dIlL '1'011 IdilL/TGM
N
500 1 605
1500 1128
800 1531J
1200 I 18
N
1000 1 805
800 /450
1200 I 35
N
800 1415
1200 I 40
N
1000 I 35
2000 1129
N
1000 I 43
2000 I 16
N
1000 /83
2000 / 17
N
1000 /95
2000 / 18
N
1000 /83
2000 / 15
N
1000 1261
2500 / 17
N
1000 1210
2500 I 28
N
I disIaatc (m) 1 TGM (nr/lll3)
1000 /152
N
I
1200 I 26
N
1200 /300
N
1200 /193
N
1500/235
N
2000 I 27
N
2000 I 20
N
3000 I 91
N
6000 I 11
S
1500 1 63
1000 I 8,8 1000 I 33 1000 I 4,8
1000 I 6.0
2000 1605 1000 I 805
S
4000 I 6.8 2500 I 505
2500 11.2 3500 I 4.4
S
4000 I 405
SW
1000 162
5000 I 7J)
1500 /32
1000 163
SW
2000 I 56
3500 I 5.3
sw
3000 rn
4000 I 705
SW
3500 110
SW
4000 144
SW
5000 I 2.6
SW
120001 3,2
SW
150001 2,4
w
1000 1161
800 I 41
W
1500 I 5.7 800 I 25
W
7000 I 5.4 800 I 35
W
1000 166
W
2500 I 6.3
W
100001 4J)
W
120001 6.0
NW
500 I 8,8 1200 I 38
1200 120
NW
1000 111
1500 146
I
NW
1500 123
1500 I 78
NW
5000 1 4,6 1500 I 39
NW
1500 I 7.9
NW
2000 I 9.0
NW
4500 1 38
3
Dispersion Modelling
The local atmospheric transport of gaseous mercury originating from emissions
at the BSL Werk Schkopau was calculated for distances of a maximum of 10 km.
A numerical model for simulating transport from individual point sources was
applied. Earlier results of this transport model (Eppel et al. 1991) compared well
with measurements within a spatial range of a maximum of 100 km.
O. Kruger et aI.
Table 1. Measurements in the surroundings of the factory premises of BSL Werk Schkopau in mean
distance from the source areas L66, 154/H56 and F44
wind- Ioc:aIioa :
Ioc:aIioa :
IoCIIioa :
IocaIioa :
IoCIIioa :
Ioc:aIioa :
Ioc:aIioa :
Ioc:IIioa :
diJecL
N
NO
0
SO
S
SW
W
NW
dilL I TOM dilL I TOM dilL I TOM dilL TOM dill. I TOM kIlL I TOM !dIlL '1'011 IdilL/TGM
N
500 1 605
1500 1128
800 1531J
1200 I 18
N
1000 1 805
800 /450
1200 I 35
N
800 1415
1200 I 40
N
1000 I 35
2000 1129
N
1000 I 43
2000 I 16
N
1000 /83
2000 / 17
N
1000 /95
2000 / 18
N
1000 /83
2000 / 15
N
1000 1261
2500 / 17
N
1000 1210
2500 I 28
N
I disIaatc (m) 1 TGM (nr/lll3)
1000 /152
N
I
1200 I 26
N
1200 /300
N
1200 /193
N
1500/235
N
2000 I 27
N
2000 I 20
N
3000 I 91
N
6000 I 11
S
1500 1 63
1000 I 8,8 1000 I 33 1000 I 4,8
1000 I 6.0
2000 1605 1000 I 805
S
4000 I 6.8 2500 I 505
2500 11.2 3500 I 4.4
S
4000 I 405
SW
1000 162
5000 I 7J)
1500 /32
1000 163
SW
2000 I 56
3500 I 5.3
sw
3000 rn
4000 I 705
SW
3500 110
SW
4000 144
SW
5000 I 2.6
SW
120001 3,2
SW
150001 2,4
w
1000 1161
800 I 41
W
1500 I 5.7 800 I 25
W
7000 I 5.4 800 I 35
W
1000 166
W
2500 I 6.3
W
100001 4J)
W
120001 6.0
NW
500 I 8,8 1200 I 38
1200 120
NW
1000 111
1500 146
I
NW
1500 123
1500 I 78
NW
5000 1 4,6 1500 I 39
NW
1500 I 7.9
NW
2000 I 9.0
NW
4500 1 38
3
Dispersion Modelling
The local atmospheric transport of gaseous mercury originating from emissions
at the BSL Werk Schkopau was calculated for distances of a maximum of 10 km.
A numerical model for simulating transport from individual point sources was
applied. Earlier results of this transport model (Eppel et al. 1991) compared well
with measurements within a spatial range of a maximum of 100 km.