

Modern Mercury Contamination from Historic Amalgamation Milling
353
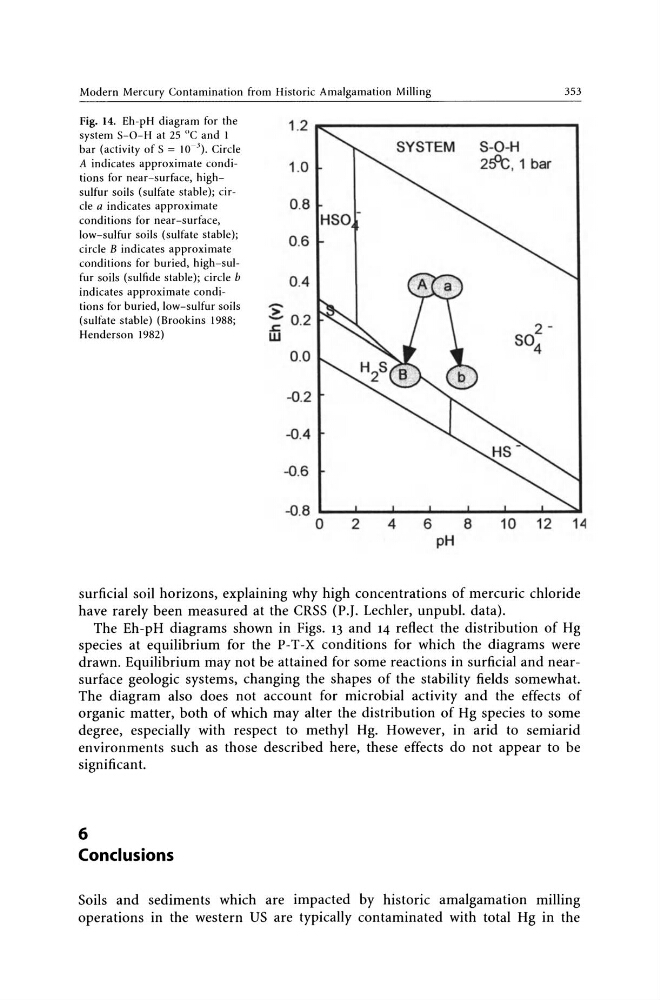
Fig. 14. Eh-pH diagram for the
system S-O-H at 25 "c a nd 1
bar (activity of S = IO- J ). Ci rcle
A indicates approximate conditions for near- surface, highsulfur soils (sulfate stable); circle a indicates approximate
conditions for near-surface,
low- sulfur soils (sulfate stable);
circle B indicates approximate
conditions for buried, high- sulfur soils (sulfide stable); circle b
indicates approximate conditions for buried, low-sulfur soils
(sulfate stable) (Brookins 1988;
Henderson 1982)
1.2 ~-----------.....,
1.0
0.8
0.6
0.4
:E .c 0.2
W
0.0
-0.2
-0.4
-0.6
-0.8
HSO
o 2 4
SYSTEM
6
8
pH
S-O-H
2s=t, 1 bar
10 12 141
surficial soil horizons, explaining why high concentrations of mercuric chloride
have rarely been measured at the CRSS (P.J. Lechler, unpubl. data).
The Eh-pH diagrams shown in Figs. 13 and 14 reflect the distribution of Hg
species at equilibrium for the P-T-X conditions for which the diagrams were
drawn. Equilibrium may not be attained for some reactions in surficial and nearsurface geologic systems, changing the shapes of the stability fields somewhat.
The diagram also does not account for microbial activity and the effects of
organic matter, both of which may alter the distribution of Hg species to some
degree, especially with respect to methyl Hg. However, in arid to semiarid
environments such as those described here, these effects do not appear to be
significant.
6
Conclusions
Soils and sediments which are impacted by historic amalgamation milling
operations in the western US are typically contaminated with total Hg in the
353
Fig. 14. Eh-pH diagram for the
system S-O-H at 25 "c a nd 1
bar (activity of S = IO- J ). Ci rcle
A indicates approximate conditions for near- surface, highsulfur soils (sulfate stable); circle a indicates approximate
conditions for near-surface,
low- sulfur soils (sulfate stable);
circle B indicates approximate
conditions for buried, high- sulfur soils (sulfide stable); circle b
indicates approximate conditions for buried, low-sulfur soils
(sulfate stable) (Brookins 1988;
Henderson 1982)
1.2 ~-----------.....,
1.0
0.8
0.6
0.4
:E .c 0.2
W
0.0
-0.2
-0.4
-0.6
-0.8
HSO
o 2 4
SYSTEM
6
8
pH
S-O-H
2s=t, 1 bar
10 12 141
surficial soil horizons, explaining why high concentrations of mercuric chloride
have rarely been measured at the CRSS (P.J. Lechler, unpubl. data).
The Eh-pH diagrams shown in Figs. 13 and 14 reflect the distribution of Hg
species at equilibrium for the P-T-X conditions for which the diagrams were
drawn. Equilibrium may not be attained for some reactions in surficial and nearsurface geologic systems, changing the shapes of the stability fields somewhat.
The diagram also does not account for microbial activity and the effects of
organic matter, both of which may alter the distribution of Hg species to some
degree, especially with respect to methyl Hg. However, in arid to semiarid
environments such as those described here, these effects do not appear to be
significant.
6
Conclusions
Soils and sediments which are impacted by historic amalgamation milling
operations in the western US are typically contaminated with total Hg in the