

298
A. Gnamus and M. Horvat
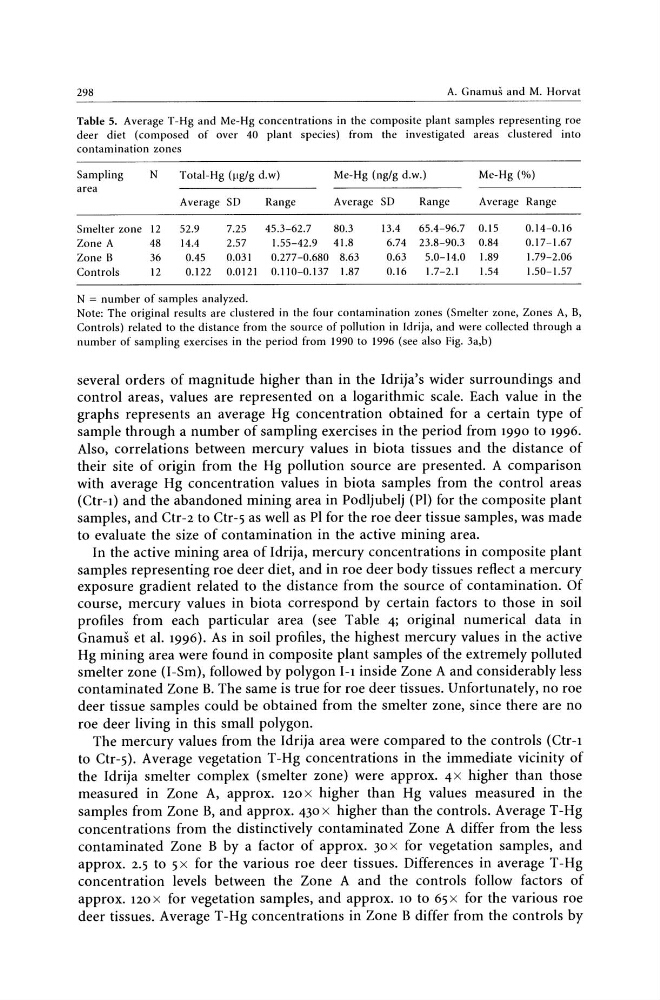
Table 5. Average T-Hg and Me-Hg concentrations in the composite plant samples representing roe
deer diet (composed of over 40 plant species) from the investigated areas clustered into
contamination zones
Sampling
N
Total-Hg (pg/g d.w)
Me-Hg (ng/g d.w.)
Me-Hg (%)
area
Average SD
Range
Average SD
Range
Average Range
Smelter zone 12
52.9
7.25
45.3-62.7
80.3
13.4
65.4-96.7 0.15
0.14-0.16
Zone A
48
14.4
2.57
1.55-42.9
41.8
6.74 23.8-90.3 0.84
0.17-1.67
Zone B
36
0.45
0.031
0.277 -0.680 8.63
0.63
5.0-14.0 1.89
1.79-2.06
Controls
12
0.122 0.0121 0.110-0.137 1.87
0.16
1.7-2.1
1.54
1.50-1.57
N = number of samples analyzed.
Note: The original results are clustered in the four contamination zones (Smelter zone, Zones A, B,
Controls) related to the distance from the source of pollution in ldrija, and were collected through a
number of sampling exercises in the period from 1990 to 1996 (see also Fig. 3a,b)
several orders of magnitude higher than in the Idrija's wider surroundings and
control areas, values are represented on a logarithmic scale. Each value in the
graphs represents an average Hg concentration obtained for a certain type of
sample through a number of sampling exercises in the period from 1990 to 1996.
Also, correlations between mercury values in biota tissues and the distance of
their site of origin from the Hg pollution source are presented. A comparison
with average Hg concentration values in biota samples from the control areas
(Ctr-l) and the abandoned mining area in Podljubelj (PI) for the composite plant
samples, and Ctr-2 to Ctr-s as well as PI for the roe deer tissue samples, was made
to evaluate the size of contamination in the active mining area.
In the active mining area of Idrija, mercury concentrations in composite plant
samples representing roe deer diet, and in roe deer body tissues reflect a mercury
exposure gradient related to the distance from the source of contamination. Of
course, mercury values in biota correspond by certain factors to those in soil
profiles from each particular area (see Table 4; original numerical data in
Gnamus et al. 1996). As in soil profiles, the highest mercury values in the active
Hg mining area were found in composite plant samples of the extremely polluted
smelter zone (I-Sm), followed by polygon I-I inside Zone A and considerably less
contaminated Zone B. The same is true for roe deer tissues. Unfortunately, no roe
deer tissue samples could be obtained from the smelter zone, since there are no
roe deer living in this small polygon.
The mercury values from the Idrija area were compared to the controls (Ctr-l
to Ctr-s). Average vegetation T-Hg concentrations in the immediate vicinity of
the Idrija smelter complex (smelter zone) were approx. 4X higher than those
measured in Zone A, approx. 120 x higher than Hg values measured in the
samples from Zone B, and approx. 430 x higher than the controls. Average T -Hg
concentrations from the distinctively contaminated Zone A differ from the less
contaminated Zone B by a factor of approx. 30 x for vegetation samples, and
approx. 2.S to S x for the various roe deer tissues. Differences in average T -Hg
concentration levels between the Zone A and the controls follow factors of
approx. 120 x for vegetation samples, and approx. 10 to 6S x for the various roe
deer tissues. Average T -Hg concentrations in Zone B differ from the controls by
A. Gnamus and M. Horvat
Table 5. Average T-Hg and Me-Hg concentrations in the composite plant samples representing roe
deer diet (composed of over 40 plant species) from the investigated areas clustered into
contamination zones
Sampling
N
Total-Hg (pg/g d.w)
Me-Hg (ng/g d.w.)
Me-Hg (%)
area
Average SD
Range
Average SD
Range
Average Range
Smelter zone 12
52.9
7.25
45.3-62.7
80.3
13.4
65.4-96.7 0.15
0.14-0.16
Zone A
48
14.4
2.57
1.55-42.9
41.8
6.74 23.8-90.3 0.84
0.17-1.67
Zone B
36
0.45
0.031
0.277 -0.680 8.63
0.63
5.0-14.0 1.89
1.79-2.06
Controls
12
0.122 0.0121 0.110-0.137 1.87
0.16
1.7-2.1
1.54
1.50-1.57
N = number of samples analyzed.
Note: The original results are clustered in the four contamination zones (Smelter zone, Zones A, B,
Controls) related to the distance from the source of pollution in ldrija, and were collected through a
number of sampling exercises in the period from 1990 to 1996 (see also Fig. 3a,b)
several orders of magnitude higher than in the Idrija's wider surroundings and
control areas, values are represented on a logarithmic scale. Each value in the
graphs represents an average Hg concentration obtained for a certain type of
sample through a number of sampling exercises in the period from 1990 to 1996.
Also, correlations between mercury values in biota tissues and the distance of
their site of origin from the Hg pollution source are presented. A comparison
with average Hg concentration values in biota samples from the control areas
(Ctr-l) and the abandoned mining area in Podljubelj (PI) for the composite plant
samples, and Ctr-2 to Ctr-s as well as PI for the roe deer tissue samples, was made
to evaluate the size of contamination in the active mining area.
In the active mining area of Idrija, mercury concentrations in composite plant
samples representing roe deer diet, and in roe deer body tissues reflect a mercury
exposure gradient related to the distance from the source of contamination. Of
course, mercury values in biota correspond by certain factors to those in soil
profiles from each particular area (see Table 4; original numerical data in
Gnamus et al. 1996). As in soil profiles, the highest mercury values in the active
Hg mining area were found in composite plant samples of the extremely polluted
smelter zone (I-Sm), followed by polygon I-I inside Zone A and considerably less
contaminated Zone B. The same is true for roe deer tissues. Unfortunately, no roe
deer tissue samples could be obtained from the smelter zone, since there are no
roe deer living in this small polygon.
The mercury values from the Idrija area were compared to the controls (Ctr-l
to Ctr-s). Average vegetation T-Hg concentrations in the immediate vicinity of
the Idrija smelter complex (smelter zone) were approx. 4X higher than those
measured in Zone A, approx. 120 x higher than Hg values measured in the
samples from Zone B, and approx. 430 x higher than the controls. Average T -Hg
concentrations from the distinctively contaminated Zone A differ from the less
contaminated Zone B by a factor of approx. 30 x for vegetation samples, and
approx. 2.S to S x for the various roe deer tissues. Differences in average T -Hg
concentration levels between the Zone A and the controls follow factors of
approx. 120 x for vegetation samples, and approx. 10 to 6S x for the various roe
deer tissues. Average T -Hg concentrations in Zone B differ from the controls by