

Mercury in Terrestrial Food Webs of the Idrija Mining Area
297
code: I-Sm). The polygons 1-1 to 1-4 lie in the wider smelter/mine area and were
grouped into Zone A, which is characterized by considerably high Hg
concentration levels in soil profiles and biota samples. The Hg concentrations
in samples obtained from the areas 1-5, 1-6 and 1-7 were grouped into Zone B
characterized by moderately elevated Hg concentrations. The same principles of
grouping were employed for all types of samples from the investigated areas.
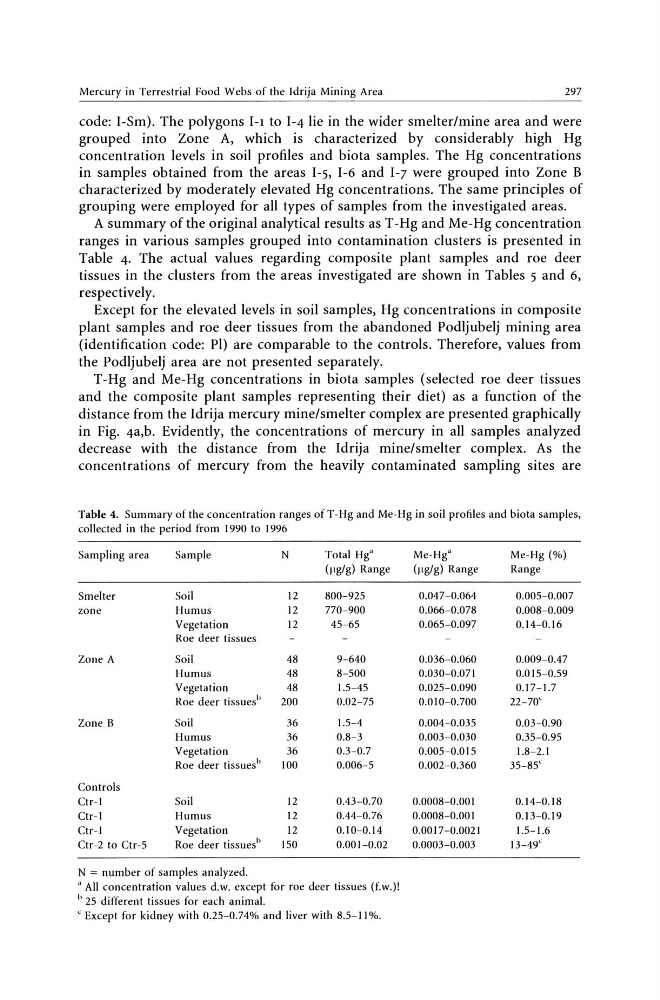
A summary of the original analytical results as T-Hg and Me-Hg concentration
ranges in various samples grouped into contamination clusters is presented in
Table 4. The actual values regarding composite plant samples and roe deer
tissues in the clusters from the areas investigated are shown in Tables 5 and 6,
respectively.
Except for the elevated levels in soil samples, Hg concentrations in composite
plant samples and roe deer tissues from the abandoned Podljubelj mining area
(identification code: PI) are comparable to the controls. Therefore, values from
the Podljubelj area are not presented separately.
T-Hg and Me-Hg concentrations in biota samples (selected roe deer tissues
and the composite plant samples representing their diet) as a function of the
distance from the Idrija mercury mine/smelter complex are presented graphically
in Fig. 4a,b. Evidently, the concentrations of mercury in all samples analyzed
decrease with the distance from the Idrija mine/smelter complex. As the
concentrations of mercury from the heavily contaminated sampling sites are
Table 4. Summary of the concentration ranges ofT-Hg and Me-Hg in soil profiles and biota samples,
collected in the period from 1990 to 1996
Sampling area
Sample
N
Total Hga
Me-Hg"
Me-Hg (%)
(~lg/g) Range
(~lg/g) Range
Range
Smelter
Soil
12
800-925
0.047-0.064
0.005-0.007
zone
Humus
12
770-900
0.066-0.078
0.008-0.009
Vegetation
12
45-65
0.065-0.097
0.14-0.16
Roe deer tissues
Zone A
Soil
48
9-640
0.036-0.060
0.009-0.47
Humus
48
8-500
0.030-0.071
0.015-0.59
Vegetation
48
1.5-45
0.025-0.090
0.17-1.7
Roe deer tissues b
200
0.02-75
0.010-0.700
22-70<
Zone B
Soil
36
1.5-4
0.004-0.035
0.03-0.90
Humus
36
0.8-3
0.003-0.030
0.35-0.95
Vegetation
36
0.3-0.7
0.005-0.015
1.8-2.1
Roe deer tissues b
100
0.006-5
0.002-0.360
35-85<
Controls
Ctr-1
Soil
12
0.43-0.70
0.0008-0.001
0.14-0.18
Ctr-l
Humus
12
0.44-0.76
0.0008-0.001
0.13-0.19
Ctr-l
Vegetation
12
0.10-0.14
0.0017 -0.0021
1.5-1.6
Ctr-2 to Ctr-5
Roe deer tissues b
150
0.001-0.02
0.0003-0.003
13-49<
N = number of samples analyzed.
a All concentration values d.w. except for roe deer tissues (f.w.)!
b 25 different tissues for each animal.
< Except for kidney with 0.25-0.74% and liver with 8.5-11%.
297
code: I-Sm). The polygons 1-1 to 1-4 lie in the wider smelter/mine area and were
grouped into Zone A, which is characterized by considerably high Hg
concentration levels in soil profiles and biota samples. The Hg concentrations
in samples obtained from the areas 1-5, 1-6 and 1-7 were grouped into Zone B
characterized by moderately elevated Hg concentrations. The same principles of
grouping were employed for all types of samples from the investigated areas.
A summary of the original analytical results as T-Hg and Me-Hg concentration
ranges in various samples grouped into contamination clusters is presented in
Table 4. The actual values regarding composite plant samples and roe deer
tissues in the clusters from the areas investigated are shown in Tables 5 and 6,
respectively.
Except for the elevated levels in soil samples, Hg concentrations in composite
plant samples and roe deer tissues from the abandoned Podljubelj mining area
(identification code: PI) are comparable to the controls. Therefore, values from
the Podljubelj area are not presented separately.
T-Hg and Me-Hg concentrations in biota samples (selected roe deer tissues
and the composite plant samples representing their diet) as a function of the
distance from the Idrija mercury mine/smelter complex are presented graphically
in Fig. 4a,b. Evidently, the concentrations of mercury in all samples analyzed
decrease with the distance from the Idrija mine/smelter complex. As the
concentrations of mercury from the heavily contaminated sampling sites are
Table 4. Summary of the concentration ranges ofT-Hg and Me-Hg in soil profiles and biota samples,
collected in the period from 1990 to 1996
Sampling area
Sample
N
Total Hga
Me-Hg"
Me-Hg (%)
(~lg/g) Range
(~lg/g) Range
Range
Smelter
Soil
12
800-925
0.047-0.064
0.005-0.007
zone
Humus
12
770-900
0.066-0.078
0.008-0.009
Vegetation
12
45-65
0.065-0.097
0.14-0.16
Roe deer tissues
Zone A
Soil
48
9-640
0.036-0.060
0.009-0.47
Humus
48
8-500
0.030-0.071
0.015-0.59
Vegetation
48
1.5-45
0.025-0.090
0.17-1.7
Roe deer tissues b
200
0.02-75
0.010-0.700
22-70<
Zone B
Soil
36
1.5-4
0.004-0.035
0.03-0.90
Humus
36
0.8-3
0.003-0.030
0.35-0.95
Vegetation
36
0.3-0.7
0.005-0.015
1.8-2.1
Roe deer tissues b
100
0.006-5
0.002-0.360
35-85<
Controls
Ctr-1
Soil
12
0.43-0.70
0.0008-0.001
0.14-0.18
Ctr-l
Humus
12
0.44-0.76
0.0008-0.001
0.13-0.19
Ctr-l
Vegetation
12
0.10-0.14
0.0017 -0.0021
1.5-1.6
Ctr-2 to Ctr-5
Roe deer tissues b
150
0.001-0.02
0.0003-0.003
13-49<
N = number of samples analyzed.
a All concentration values d.w. except for roe deer tissues (f.w.)!
b 25 different tissues for each animal.
< Except for kidney with 0.25-0.74% and liver with 8.5-11%.