

210
R.V. Marins et aL
published in the international literature. However, wherever published emission
parameters exist for Brazilian plants and processes, they were preferentially used.
The same procedures were used for estimating potential Hg emissions from
urban sources.
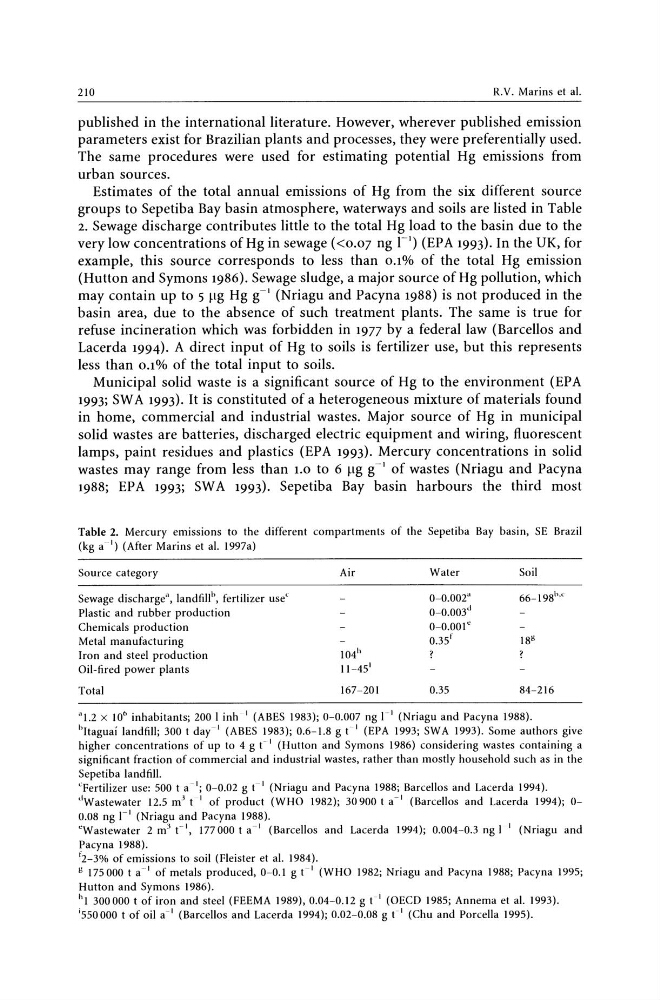
Estimates of the total annual emissions of Hg from the six different source
groups to Sepetiba Bay basin atmosphere, waterways and soils are listed in Table
2. Sewage discharge contributes little to the total Hg load to the basin due to the
very low concentrations of Hg in sewage «0.07 ng I-I) (EPA 1993). In the UK, for
example, this source corresponds to less than 0.1% of the total Hg emission
(Hutton and Symons 1986). Sewage sludge, a major source ofHg pollution, which
may contain up to 5 ~lg Hg g-I (Nriagu and Pacyna 1988) is not produced in the
basin area, due to the absence of such treatment plants. The same is true for
refuse incineration which was forbidden in 1977 by a federal law (Barcellos and
Lacerda 1994). A direct input of Hg to soils is fertilizer use, but this represents
less than 0.1% of the total input to soils.
Municipal solid waste is a significant source of Hg to the environment (EPA
1993; SW A 1993). It is constituted of a heterogeneous mixture of materials found
in home, commercial and industrial wastes. Major source of Hg in municipal
solid wastes are batteries, discharged electric equipment and wiring, fluorescent
lamps, paint residues and plastics (EPA 1993). Mercury concentrations in solid
wastes may range from less than 1.0 to 6 ~lg g-I of wastes (Nriagu and Pacyna
1988; EPA 1993; SW A 1993). Sepetiba Bay basin harbours the third most
Table 2. Mercury emissions to the different compartments of the Sepetiba Bay basin, SE Brazil
(kg a I) (After Marins et aL 1997a)
Source category
Sewage discharge", landfill b , fertilizer use"
Plastic and rubber production
Chemicals production
Metal manufacturing
Iron and steel production
Oil-fired power plants
Total
Air
104 h
11-45 1
167-201
Water
Soil
0-0.002"
66_198 1v
0-0.003 d
0-0.001'
0.35'
IS g
0.35
84-216
"1.2 X 10" inhabitants; 200 I inh-' (ABES 1983); 0-0.007 ng 1-' (Nriagu and Pacyna 1988).
bltaguai landfill; 300 t day-' (ABES 1983); 0.6-1.8 g t ' (EPA 1993; SWA 1993). Some authors give
higher concentrations of up to 4 g t-' (Hutton and Symons 1986) considering wastes containing a
significant fraction of commercial and industrial wastes, rather than mostly household such as in the
Sepetiba landfilL
'Fertilizer use: 500 t a -'; 0-0.02 g t ' (Nriagu and Pacyna 1988; Barcellos and Lacerda 1994).
dWastewater 12.5 m J t ' of product (WHO 1982); 30900 t a-' (Barcellos and Lacerda 1994); 00.08 ng 1-' (Nriagu and Pacyna 1988).
'Wastewater 2 m 3 C', 177000 t a-' (Barcellos and Lacerda 1994); 0.004-0.3 ng I ' (Nriagu and
Pacyna 1988).
f2_3% of emissions to soil (Fleister et aL 1984).
g 175000 t a-' of metals produced, 0-0.1 g C' (WHO 1982; Nriagu and Pacyna 1988; Pacyna 1995;
Hutton and Symons 1986).
hi 300000 t of iron and steel (FEEMA 1989),0.04-0.12 g ("' (OECD 1985; Annema et aL 1993).
i550000 t of oil a-' (Barcellos and Lacerda 1994); 0.02-0.08 g t I (Chu and Porcella 1995).
R.V. Marins et aL
published in the international literature. However, wherever published emission
parameters exist for Brazilian plants and processes, they were preferentially used.
The same procedures were used for estimating potential Hg emissions from
urban sources.
Estimates of the total annual emissions of Hg from the six different source
groups to Sepetiba Bay basin atmosphere, waterways and soils are listed in Table
2. Sewage discharge contributes little to the total Hg load to the basin due to the
very low concentrations of Hg in sewage «0.07 ng I-I) (EPA 1993). In the UK, for
example, this source corresponds to less than 0.1% of the total Hg emission
(Hutton and Symons 1986). Sewage sludge, a major source ofHg pollution, which
may contain up to 5 ~lg Hg g-I (Nriagu and Pacyna 1988) is not produced in the
basin area, due to the absence of such treatment plants. The same is true for
refuse incineration which was forbidden in 1977 by a federal law (Barcellos and
Lacerda 1994). A direct input of Hg to soils is fertilizer use, but this represents
less than 0.1% of the total input to soils.
Municipal solid waste is a significant source of Hg to the environment (EPA
1993; SW A 1993). It is constituted of a heterogeneous mixture of materials found
in home, commercial and industrial wastes. Major source of Hg in municipal
solid wastes are batteries, discharged electric equipment and wiring, fluorescent
lamps, paint residues and plastics (EPA 1993). Mercury concentrations in solid
wastes may range from less than 1.0 to 6 ~lg g-I of wastes (Nriagu and Pacyna
1988; EPA 1993; SW A 1993). Sepetiba Bay basin harbours the third most
Table 2. Mercury emissions to the different compartments of the Sepetiba Bay basin, SE Brazil
(kg a I) (After Marins et aL 1997a)
Source category
Sewage discharge", landfill b , fertilizer use"
Plastic and rubber production
Chemicals production
Metal manufacturing
Iron and steel production
Oil-fired power plants
Total
Air
104 h
11-45 1
167-201
Water
Soil
0-0.002"
66_198 1v
0-0.003 d
0-0.001'
0.35'
IS g
0.35
84-216
"1.2 X 10" inhabitants; 200 I inh-' (ABES 1983); 0-0.007 ng 1-' (Nriagu and Pacyna 1988).
bltaguai landfill; 300 t day-' (ABES 1983); 0.6-1.8 g t ' (EPA 1993; SWA 1993). Some authors give
higher concentrations of up to 4 g t-' (Hutton and Symons 1986) considering wastes containing a
significant fraction of commercial and industrial wastes, rather than mostly household such as in the
Sepetiba landfilL
'Fertilizer use: 500 t a -'; 0-0.02 g t ' (Nriagu and Pacyna 1988; Barcellos and Lacerda 1994).
dWastewater 12.5 m J t ' of product (WHO 1982); 30900 t a-' (Barcellos and Lacerda 1994); 00.08 ng 1-' (Nriagu and Pacyna 1988).
'Wastewater 2 m 3 C', 177000 t a-' (Barcellos and Lacerda 1994); 0.004-0.3 ng I ' (Nriagu and
Pacyna 1988).
f2_3% of emissions to soil (Fleister et aL 1984).
g 175000 t a-' of metals produced, 0-0.1 g C' (WHO 1982; Nriagu and Pacyna 1988; Pacyna 1995;
Hutton and Symons 1986).
hi 300000 t of iron and steel (FEEMA 1989),0.04-0.12 g ("' (OECD 1985; Annema et aL 1993).
i550000 t of oil a-' (Barcellos and Lacerda 1994); 0.02-0.08 g t I (Chu and Porcella 1995).