

Relative Importance of Non-Point Sources of Mercury
209
the bay's bottom sediments. Since sediment profiles can be strongly related to Hg
loading rates (Rasmussen 1994), it is reasonable to advance increasing Hg inputs
to Sepetiba Bay. Therefore, the objective of the present study is to quantify the
major sources, inputs and input pathways, and the fate of Hg into Sepetiba Bay.
3
Mercury Emissions to Sepetiba Bay and Basin
Sepetiba Bay basin harbors over 400 industries using a great diversity of
technologies and final products which makes the quantification of Hg emissions
from individual industrial plants difficult. We studied the most representative of
these industries, those which employ over 60 people and are potential sources of
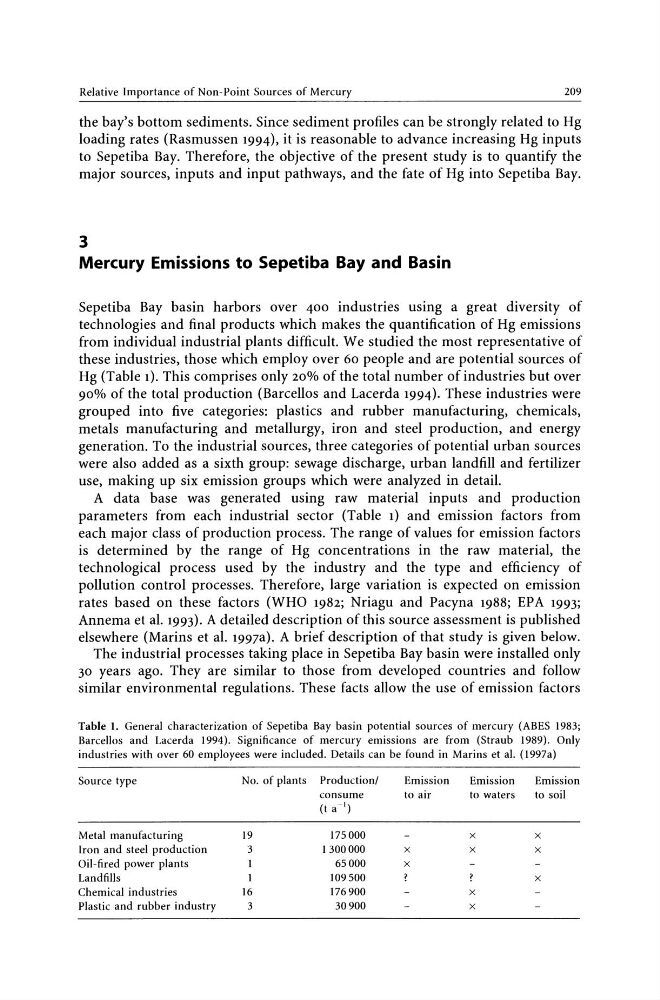
Hg (Table 1). This comprises only 20% of the total number of industries but over
90% of the total production (Barcellos and Lacerda 1994). These industries were
grouped into five categories: plastics and rubber manufacturing, chemicals,
metals manufacturing and metallurgy, iron and steel production, and energy
generation. To the industrial sources, three categories of potential urban sources
were also added as a sixth group: sewage discharge, urban landfill and fertilizer
use, making up six emission groups which were analyzed in detail.
A data base was generated using raw material inputs and production
parameters from each industrial sector (Table 1) and emission factors from
each major class of production process. The range of values for emission factors
is determined by the range of Hg concentrations in the raw material, the
technological process used by the industry and the type and efficiency of
pollution control processes. Therefore, large variation is expected on emission
rates based on these factors (WHO 1982; Nriagu and Pacyna 1988; EPA 1993;
Annema et al. 1993). A detailed description of this source assessment is published
elsewhere (Marins et al. 1997a). A brief description of that study is given below.
The industrial processes taking place in Sepetiba Bay basin were installed only
30 years ago. They are similar to those from developed countries and follow
similar environmental regulations. These facts allow the use of emission factors
Table l. General characterization of Sepetiba Bay basin potential sources of mercury (ABES 1983;
Barcellos and Lacerda 1994). Significance of mercury emissions are from (Straub 1989). Only
industries with over 60 employees were included. Details can be found in Marins et al. (1997a)
Source type
No. of plants Production/
Emission
Emission
Emission
consume
to air
to waters
to soil
(t a-I)
Metal manufacturing
19
175000
x
x
Iron and steel production
3
1300000
x
x
x
Oil-fired power plants
65000
x
Landfills
109500
x
Chemical industries
16
176900
x
Plastic and rubber industry
3
30900
x
209
the bay's bottom sediments. Since sediment profiles can be strongly related to Hg
loading rates (Rasmussen 1994), it is reasonable to advance increasing Hg inputs
to Sepetiba Bay. Therefore, the objective of the present study is to quantify the
major sources, inputs and input pathways, and the fate of Hg into Sepetiba Bay.
3
Mercury Emissions to Sepetiba Bay and Basin
Sepetiba Bay basin harbors over 400 industries using a great diversity of
technologies and final products which makes the quantification of Hg emissions
from individual industrial plants difficult. We studied the most representative of
these industries, those which employ over 60 people and are potential sources of
Hg (Table 1). This comprises only 20% of the total number of industries but over
90% of the total production (Barcellos and Lacerda 1994). These industries were
grouped into five categories: plastics and rubber manufacturing, chemicals,
metals manufacturing and metallurgy, iron and steel production, and energy
generation. To the industrial sources, three categories of potential urban sources
were also added as a sixth group: sewage discharge, urban landfill and fertilizer
use, making up six emission groups which were analyzed in detail.
A data base was generated using raw material inputs and production
parameters from each industrial sector (Table 1) and emission factors from
each major class of production process. The range of values for emission factors
is determined by the range of Hg concentrations in the raw material, the
technological process used by the industry and the type and efficiency of
pollution control processes. Therefore, large variation is expected on emission
rates based on these factors (WHO 1982; Nriagu and Pacyna 1988; EPA 1993;
Annema et al. 1993). A detailed description of this source assessment is published
elsewhere (Marins et al. 1997a). A brief description of that study is given below.
The industrial processes taking place in Sepetiba Bay basin were installed only
30 years ago. They are similar to those from developed countries and follow
similar environmental regulations. These facts allow the use of emission factors
Table l. General characterization of Sepetiba Bay basin potential sources of mercury (ABES 1983;
Barcellos and Lacerda 1994). Significance of mercury emissions are from (Straub 1989). Only
industries with over 60 employees were included. Details can be found in Marins et al. (1997a)
Source type
No. of plants Production/
Emission
Emission
Emission
consume
to air
to waters
to soil
(t a-I)
Metal manufacturing
19
175000
x
x
Iron and steel production
3
1300000
x
x
x
Oil-fired power plants
65000
x
Landfills
109500
x
Chemical industries
16
176900
x
Plastic and rubber industry
3
30900
x