

Mercury Contamination of Minamata Bay
151
100
.•
• Hormomya mutabilis
~ 80
o Venus japonica
- -
-
-
0
0)
0
~
60
-
•
0)
E
•
-- 0) 40
I
0
• •
to
0
0
o!:Oo
+-'
20
0
DOD
l• •
•
• o
[{]~
o o lD a:5l
DO 0
0
1958
1961
1964
1967
1970
1973
Date
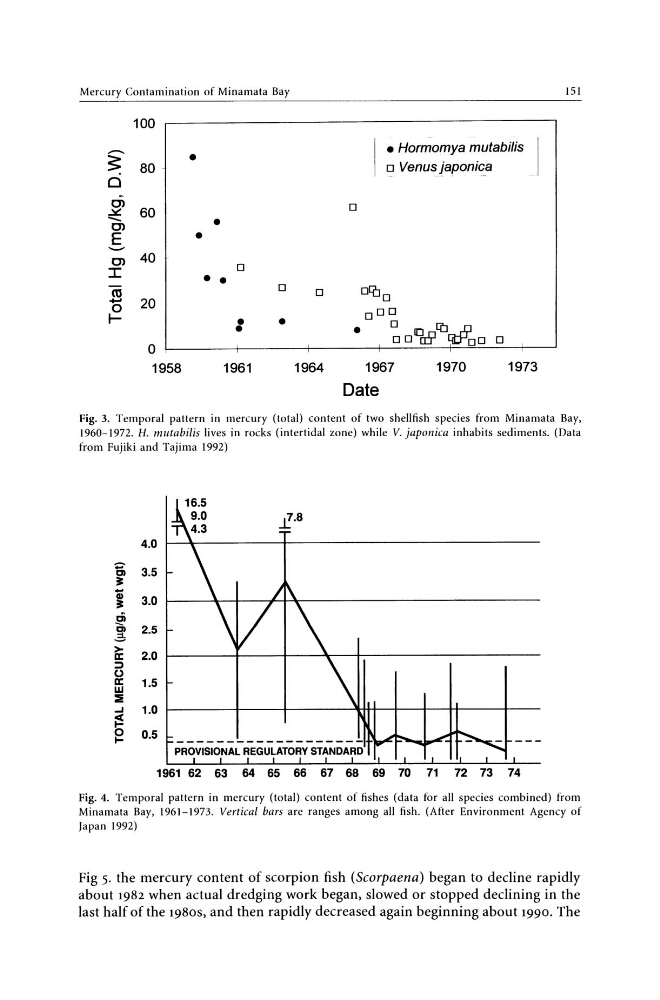
Fig. 3. Temporal pattern in mercury (total) content of two shellfish species from Minamata Bay,
1960-1972. H. mutabilis lives in rocks (intertidal zone) while V. japonica inhabits sediments. (Data
from Fujiki and Tajima 1992)
5 it
;
~
~
i;:
:::I
o
a::
w
:::&
4.0
3.5
3.0 ~------l~.J...._-..LI~-------------2.5
2.0 ~---.J...._-___.j~-_+_-.J...._---------1.5
....I
1.0 1 - - - - - I - - - - I - - - - - - . l l - t H - - I - - I - - - 4 + - - - - + - -
~
e 0.5 ___________________ 1.U_~_.L-O&,,"""..1
PROVISIONAL REGULATORY STANDARD
1961 62 63 64 65 66 67 68 69 70 71 72 73 74
Fig. 4. Temporal pattern in mercury (total) content of fishes (data for all species combined) from
Minamata Bay, 1961-1973. Vertical bars are ranges among all fish. (After Environment Agency of
Japan 1992)
Fig 5. the mercury content of scorpion fish (Scorpaena) began to decline rapidly
about 1982 when actual dredging work began, slowed or stopped declining in the
last half of the 1980s, and then rapidly decreased again beginning about 1990. The
151
100
.•
• Hormomya mutabilis
~ 80
o Venus japonica
- -
-
-
0
0)
0
~
60
-
•
0)
E
•
-- 0) 40
I
0
• •
to
0
0
o!:Oo
+-'
20
0
DOD
l• •
•
• o
[{]~
o o lD a:5l
DO 0
0
1958
1961
1964
1967
1970
1973
Date
Fig. 3. Temporal pattern in mercury (total) content of two shellfish species from Minamata Bay,
1960-1972. H. mutabilis lives in rocks (intertidal zone) while V. japonica inhabits sediments. (Data
from Fujiki and Tajima 1992)
5 it
;
~
~
i;:
:::I
o
a::
w
:::&
4.0
3.5
3.0 ~------l~.J...._-..LI~-------------2.5
2.0 ~---.J...._-___.j~-_+_-.J...._---------1.5
....I
1.0 1 - - - - - I - - - - I - - - - - - . l l - t H - - I - - I - - - 4 + - - - - + - -
~
e 0.5 ___________________ 1.U_~_.L-O&,,"""..1
PROVISIONAL REGULATORY STANDARD
1961 62 63 64 65 66 67 68 69 70 71 72 73 74
Fig. 4. Temporal pattern in mercury (total) content of fishes (data for all species combined) from
Minamata Bay, 1961-1973. Vertical bars are ranges among all fish. (After Environment Agency of
Japan 1992)
Fig 5. the mercury content of scorpion fish (Scorpaena) began to decline rapidly
about 1982 when actual dredging work began, slowed or stopped declining in the
last half of the 1980s, and then rapidly decreased again beginning about 1990. The