

102
R.R. Turner and G.R. Southworth
concentrations in 75 years. The completion in 1994 of the leachate collection and
treatment system for Pond 5 at the site was followed by a decrease in mean
mercury concentrations in fish at the uppermost monitoring sites in 1995. The
treatment system eliminates a major remaining source of dissolved mercury
inputs to NFHR, and may be effective at accelerating the rate at which mercury
contamination in fish decreases in the river.
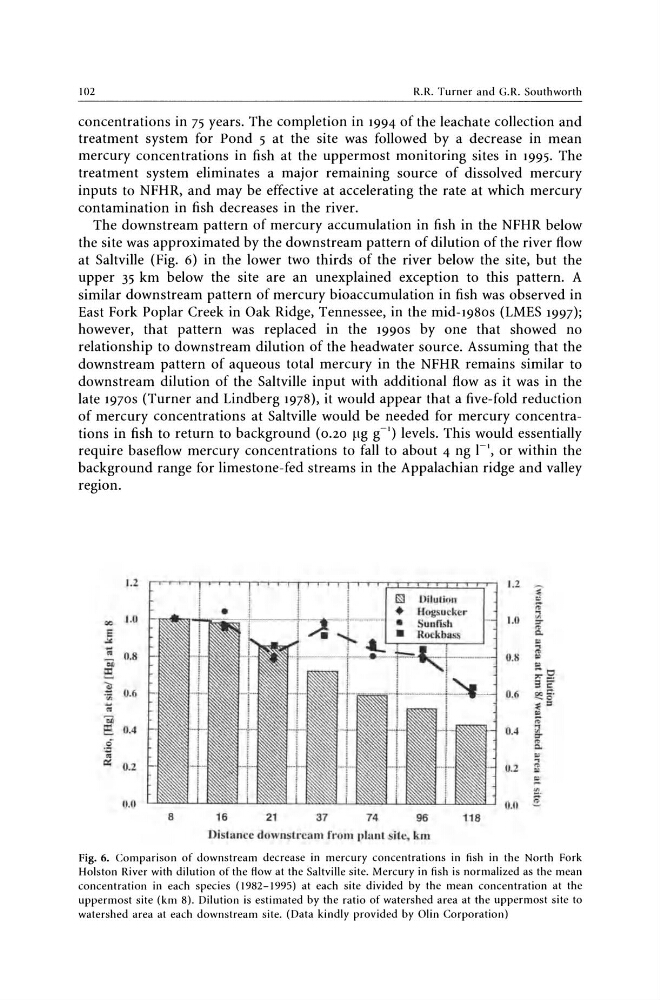
The downstream pattern of mercury accumulation in fish in the NFHR below
the site was approximated by the downstream pattern of dilution of the river flow
at Saltville (Fig. 6) in the lower two thirds of the river below the site, but the
upper 35 km below the site are an unexplained exception to this pattern. A
similar downstream pattern of mercury bioaccumulation in fish was observed in
East Fork Poplar Creek in Oak Ridge, Tennessee, in the mid-1980s (LMES 1997);
however, that pattern was replaced in the 1990S by one that showed no
relationship to downstream dilution of the headwater source. Assuming that the
downstream pattern of aqueous total mercury in the NFHR remains similar to
downstream dilution of the Saltville input with additional flow as it was in the
late 1970S (Turner and Lindberg 1978), it would appear that a five-fold reduction
of mercury concentrations at Saltville would be needed for mercury concentrations in fish to return to background (0.20 ~tg g - ') levels. This would essentially
require base flow mercury concentrations to fall to about 4 ng 1- ', or within the
background range for limestone-fed streams in the Appalachian ridge and valley
region.
J.2
1.2 :<
a
t>
oc 1.0
5
1.0
::l
::r
'" Q.
""
. .
"
0.8
00
...
t>
0.8
. .
..
~
- 0
"' " _.
~ 0.6
.;;;
3C'
0.6 ~g.
..
:< =
"
00
:;
~ 0.4
0.4 (;l
::r
IS
'.0
8.
"
c.: 0.2
:;
0.2
~
~
~ .
0.0
0.0 .e
8
16
21
37
74
96
118
Distance downsl!'eam f.·om plant site, km
Fig. 6. Comparison of downstream decrease in mercury concentrations in fish in the North Fork
Holston River with dilution of the flow at the Saltville site. Mercury in fish is normalized as the mean
concentration in each species (1982-1995) at each site divided by the mean concentration at the
uppermost site (km 8). Dilution is estimated by the ratio of watershed area at the uppermost site to
watershed area at each downstream site. (Data kindly provided by Olin Corporation)
R.R. Turner and G.R. Southworth
concentrations in 75 years. The completion in 1994 of the leachate collection and
treatment system for Pond 5 at the site was followed by a decrease in mean
mercury concentrations in fish at the uppermost monitoring sites in 1995. The
treatment system eliminates a major remaining source of dissolved mercury
inputs to NFHR, and may be effective at accelerating the rate at which mercury
contamination in fish decreases in the river.
The downstream pattern of mercury accumulation in fish in the NFHR below
the site was approximated by the downstream pattern of dilution of the river flow
at Saltville (Fig. 6) in the lower two thirds of the river below the site, but the
upper 35 km below the site are an unexplained exception to this pattern. A
similar downstream pattern of mercury bioaccumulation in fish was observed in
East Fork Poplar Creek in Oak Ridge, Tennessee, in the mid-1980s (LMES 1997);
however, that pattern was replaced in the 1990S by one that showed no
relationship to downstream dilution of the headwater source. Assuming that the
downstream pattern of aqueous total mercury in the NFHR remains similar to
downstream dilution of the Saltville input with additional flow as it was in the
late 1970S (Turner and Lindberg 1978), it would appear that a five-fold reduction
of mercury concentrations at Saltville would be needed for mercury concentrations in fish to return to background (0.20 ~tg g - ') levels. This would essentially
require base flow mercury concentrations to fall to about 4 ng 1- ', or within the
background range for limestone-fed streams in the Appalachian ridge and valley
region.
J.2
1.2 :<
a
t>
oc 1.0
5
1.0
::l
::r
'" Q.
""
. .
"
0.8
00
...
t>
0.8
. .
..
~
- 0
"' " _.
~ 0.6
.;;;
3C'
0.6 ~g.
..
:< =
"
00
:;
~ 0.4
0.4 (;l
::r
IS
'.0
8.
"
c.: 0.2
:;
0.2
~
~
~ .
0.0
0.0 .e
8
16
21
37
74
96
118
Distance downsl!'eam f.·om plant site, km
Fig. 6. Comparison of downstream decrease in mercury concentrations in fish in the North Fork
Holston River with dilution of the flow at the Saltville site. Mercury in fish is normalized as the mean
concentration in each species (1982-1995) at each site divided by the mean concentration at the
uppermost site (km 8). Dilution is estimated by the ratio of watershed area at the uppermost site to
watershed area at each downstream site. (Data kindly provided by Olin Corporation)