

Hg-Contaminated Industrial and Mining Sites in N. America
101
watersheds are 1-5 ng I-I for total mercury and 0.02-0.06 ng I-I for methylmercury. Dry weather total mercury concentrations in NFHR at Saltville in the late
1970S were typically in the range from 100-200 ng I-I (Turner and Lindberg
1978).
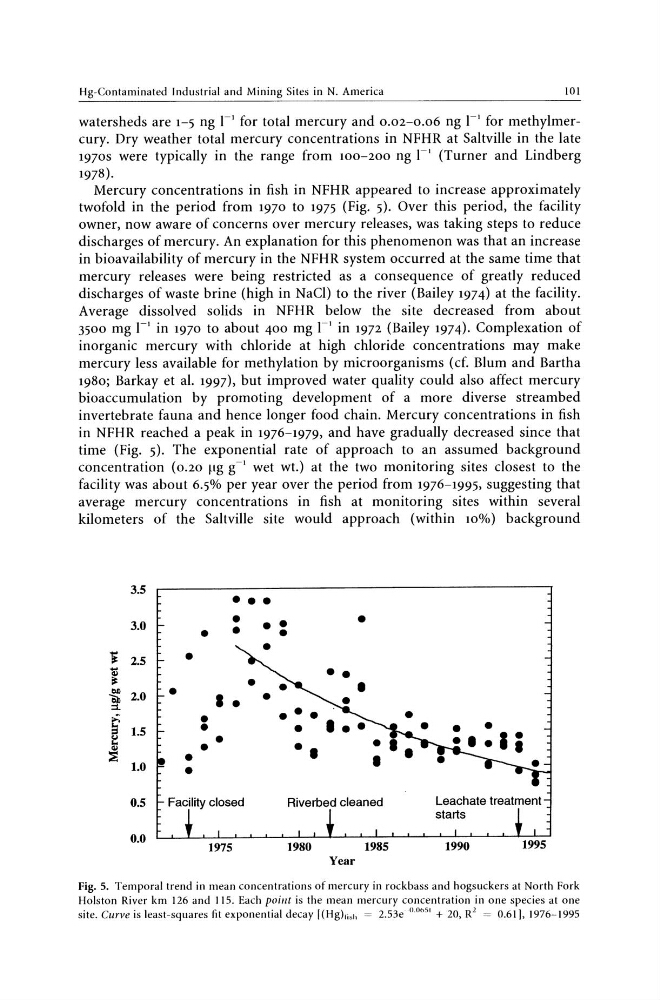
Mercury concentrations in fish in NFHR appeared to increase approximately
twofold in the period from 1970 to 1975 (Fig. 5). Over this period, the facility
owner, now aware of concerns over mercury releases, was taking steps to reduce
discharges of mercury. An explanation for this phenomenon was that an increase
in bioavailability of mercury in the NFHR system occurred at the same time that
mercury releases were being restricted as a consequence of greatly reduced
discharges of waste brine (high in NaCl) to the river (Bailey 1974) at the facility.
Average dissolved solids in NFHR below the site decreased from about
3500 mg I-I in 1970 to about 400 mg I-I in 1972 (Bailey 1974). Complexation of
inorganic mercury with chloride at high chloride concentrations may make
mercury less available for methylation by microorganisms (cf. Blum and Bartha
1980; Barkay et al. 1997), but improved water quality could also affect mercury
bioaccumulation by promoting development of a more diverse streambed
invertebrate fauna and hence longer food chain. Mercury concentrations in fish
in NFHR reached a peak in 1976-1979, and have gradually decreased since that
time (Fig. 5). The exponential rate of approach to an assumed background
concentration (0.20 pg g - I wet wt.) at the two monitoring sites closest to the
facility was about 6.5% per year over the period from 1976-1995, suggesting that
average mercury concentrations in fish at monitoring sites within several
kilometers of the Saltville site would approach (within 10%) background
Fig. 5. Temporal trend in mean concentrations of mercury in rockbass and hogsuckers at North Fork
Holston River km 126 and 115. Each poillt is the mean mercury concentration in one species at one
site. Curve is least-squares fit exponential decay [(Hg)li,h = 2.53eo.0651 + 20, Rl = 0.61]' 1976-1995
101
watersheds are 1-5 ng I-I for total mercury and 0.02-0.06 ng I-I for methylmercury. Dry weather total mercury concentrations in NFHR at Saltville in the late
1970S were typically in the range from 100-200 ng I-I (Turner and Lindberg
1978).
Mercury concentrations in fish in NFHR appeared to increase approximately
twofold in the period from 1970 to 1975 (Fig. 5). Over this period, the facility
owner, now aware of concerns over mercury releases, was taking steps to reduce
discharges of mercury. An explanation for this phenomenon was that an increase
in bioavailability of mercury in the NFHR system occurred at the same time that
mercury releases were being restricted as a consequence of greatly reduced
discharges of waste brine (high in NaCl) to the river (Bailey 1974) at the facility.
Average dissolved solids in NFHR below the site decreased from about
3500 mg I-I in 1970 to about 400 mg I-I in 1972 (Bailey 1974). Complexation of
inorganic mercury with chloride at high chloride concentrations may make
mercury less available for methylation by microorganisms (cf. Blum and Bartha
1980; Barkay et al. 1997), but improved water quality could also affect mercury
bioaccumulation by promoting development of a more diverse streambed
invertebrate fauna and hence longer food chain. Mercury concentrations in fish
in NFHR reached a peak in 1976-1979, and have gradually decreased since that
time (Fig. 5). The exponential rate of approach to an assumed background
concentration (0.20 pg g - I wet wt.) at the two monitoring sites closest to the
facility was about 6.5% per year over the period from 1976-1995, suggesting that
average mercury concentrations in fish at monitoring sites within several
kilometers of the Saltville site would approach (within 10%) background
Fig. 5. Temporal trend in mean concentrations of mercury in rockbass and hogsuckers at North Fork
Holston River km 126 and 115. Each poillt is the mean mercury concentration in one species at one
site. Curve is least-squares fit exponential decay [(Hg)li,h = 2.53eo.0651 + 20, Rl = 0.61]' 1976-1995