

Hg-Contaminated Industrial and Mining Sites in N. America
::::;rn
6
r
a:
::J
()
a:
UJ
::?:
--'
<{
r
0
r
2500
2000
~
~
>a:
::J
0
a:
1500
w
:;;
-'
"' "
t0
t1000
500
ORNL 97·129404/lmh
STATION 17
2.5
2.0
1.5
1.0
0.5
0.01/891/901/91 1/921/93 1/941/95 1/961/971/98
,
DATE
\
, , , , , , , ,
\
\
\
\
\
\
\
OWu~~~~~~~~~u.~~~~u.~~~.u~
1~1~1~1~1~1~1~1~1~1~1~1~
YEAR
97
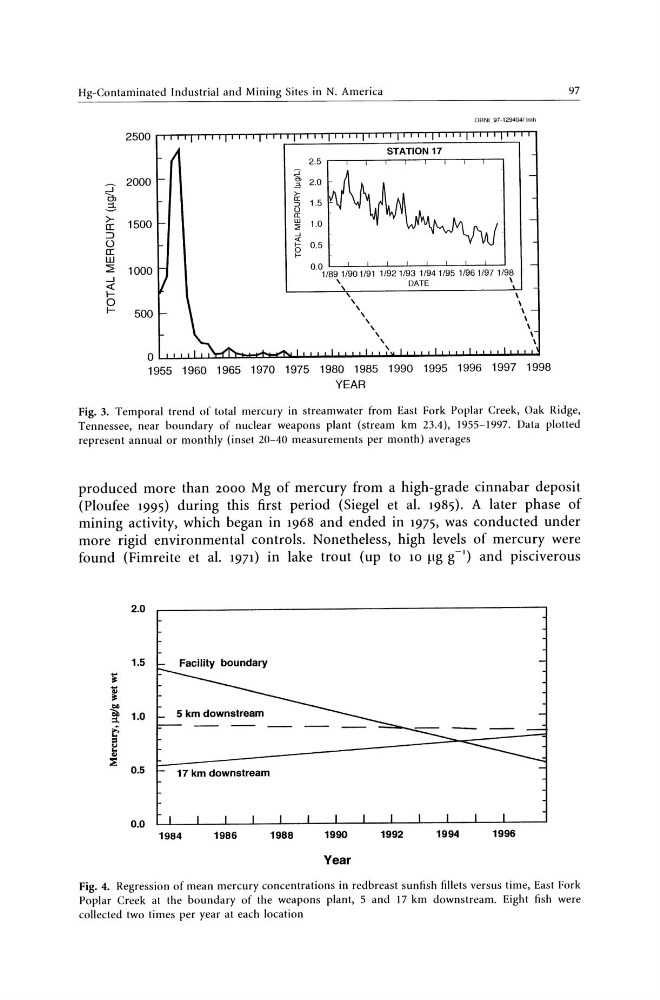
Fig. 3. Temporal trend of total mercury in streamwater from East Fork Poplar Creek, Oak Ridge,
Tennessee, near boundary of nuclear weapons plant (stream km 23.4), 1955-1997. Data plotted
represent annual or monthly (inset 20-40 measurements per month) averages
produced more than 2000 Mg of mercury from a high-grade cinnabar deposit
(Ploufee 1995) during this first period (Siegel et al. 1985). A later phase of
mining activity, which began in 1968 and ended in 1975, was conducted under
more rigid environmental controls. Nonetheless, high levels of mercury were
found (Fimreite et al. 1971) in lake trout (up to 10 pg g -I) and pisciverous
2.0
1.5
~
~ ..
Ob 1.0
5 km downstream
::l
6
-- -- -=
" ...
'"
::;;
0.5
17 km downstream
0.0
1984
1986
1988
1990
1992
1994
1996
Year
Fig. 4. Regression of mean mercury concentrations in redbreast sunfish fillets versus time, East Fork
Poplar Creek at the boundary of the weapons plant, 5 and 17 km downstream. Eight fish were
collected two times per year at each location
::::;rn
6
r
a:
::J
()
a:
UJ
::?:
--'
<{
r
0
r
2500
2000
~
~
>a:
::J
0
a:
1500
w
:;;
-'
"' "
t0
t1000
500
ORNL 97·129404/lmh
STATION 17
2.5
2.0
1.5
1.0
0.5
0.01/891/901/91 1/921/93 1/941/95 1/961/971/98
,
DATE
\
, , , , , , , ,
\
\
\
\
\
\
\
OWu~~~~~~~~~u.~~~~u.~~~.u~
1~1~1~1~1~1~1~1~1~1~1~1~
YEAR
97
Fig. 3. Temporal trend of total mercury in streamwater from East Fork Poplar Creek, Oak Ridge,
Tennessee, near boundary of nuclear weapons plant (stream km 23.4), 1955-1997. Data plotted
represent annual or monthly (inset 20-40 measurements per month) averages
produced more than 2000 Mg of mercury from a high-grade cinnabar deposit
(Ploufee 1995) during this first period (Siegel et al. 1985). A later phase of
mining activity, which began in 1968 and ended in 1975, was conducted under
more rigid environmental controls. Nonetheless, high levels of mercury were
found (Fimreite et al. 1971) in lake trout (up to 10 pg g -I) and pisciverous
2.0
1.5
~
~ ..
Ob 1.0
5 km downstream
::l
6
-- -- -=
" ...
'"
::;;
0.5
17 km downstream
0.0
1984
1986
1988
1990
1992
1994
1996
Year
Fig. 4. Regression of mean mercury concentrations in redbreast sunfish fillets versus time, East Fork
Poplar Creek at the boundary of the weapons plant, 5 and 17 km downstream. Eight fish were
collected two times per year at each location