

512
Y. Folkman and A.M. Wachs
Discussion and Conclusions
The rate of ammonia release from an open container with pH=11.0 is influenced by
the temperature of the liquid, the liquid depth and the wind velocity. Those parameters
are represented in eq. (14) by the ratio K = k u kj/h which determines the slope of the lines
in Figs. 2 and 3. In relation to the preliminary experiments, the slopes K from Fig. 2 and
the product k kj calculated as a function of the depth are shown in Table 1.
Table 1: Rates of Ammonia Release from tanks containing
lime treated effluent
hem
16
18
30
30
57
75
90
90
u km/hr
T °C
K x l 0
2 l / h r
kjcj cm/hr
2 - 1 5 2 - 1 5
0
19
13.5
19
3
2.41 0.47
0.48
0.48 0.14
2 - 15 "1- 12 2 - 1 5 3 - 15 1 - 1 8
19
11
19
10
12
1.96
0.79
0.65
0.36
0.50
0.58
0.45
0.49
0.32
0.45
As can be seen in Table 1, the experiments (except for the 30 cm beaker, tested in still
air) covered a wide range of wind velocities (in most cases 2-15 km/h), the temperature
varying from 10°C to 19°C. In spite of this, the range of k u kj values was fairly narrow in
five cases out of seven — 0.43 to 0.49 cm/h, with an average of 0.46 cm/hr.
cm/hr
1.21.0
0.40.2!
i
0T
1 —r—1—r= 25°C
A yS
•
T—1—1—1—r
LEGEND
h=30 cm a
h=45 cm A
h = 90 cm ·
-1—\—1—1—1—1—1
'
0
5
10
15
WIND VELOCITY u (km/hr)
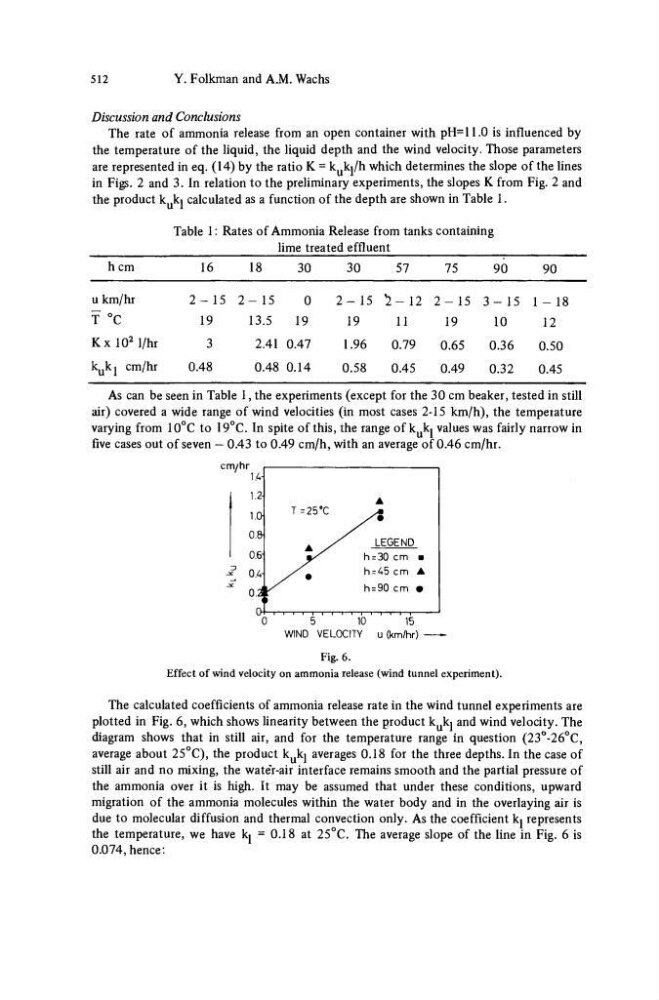
Fig. 6.
Effect of wind velocity on ammonia release (wind tunnel experiment).
The calculated coefficients of ammonia release rate in the wind tunnel experiments are
plotted in Fig. 6, which shows linearity between the product k u kj and wind velocity. The
diagram shows that in still air, and for the temperature range in question (23°-26°C,
average about 25°C), the product k u kj averages 0.18 for the three depths. In the case of
still air and no mixing, the wateV-air interface remains smooth and the partial pressure of
the ammonia over it is high. It may be assumed that under these conditions, upward
migration of the ammonia molecules within the water body and in the overlaying air is
due to molecular diffusion and thermal convection only. As the coefficient ki represents
the temperature, we have kj = 0.18 at 25°C. The average slope of the line in Fig. 6 is
0.074, hence:
Y. Folkman and A.M. Wachs
Discussion and Conclusions
The rate of ammonia release from an open container with pH=11.0 is influenced by
the temperature of the liquid, the liquid depth and the wind velocity. Those parameters
are represented in eq. (14) by the ratio K = k u kj/h which determines the slope of the lines
in Figs. 2 and 3. In relation to the preliminary experiments, the slopes K from Fig. 2 and
the product k kj calculated as a function of the depth are shown in Table 1.
Table 1: Rates of Ammonia Release from tanks containing
lime treated effluent
hem
16
18
30
30
57
75
90
90
u km/hr
T °C
K x l 0
2 l / h r
kjcj cm/hr
2 - 1 5 2 - 1 5
0
19
13.5
19
3
2.41 0.47
0.48
0.48 0.14
2 - 15 "1- 12 2 - 1 5 3 - 15 1 - 1 8
19
11
19
10
12
1.96
0.79
0.65
0.36
0.50
0.58
0.45
0.49
0.32
0.45
As can be seen in Table 1, the experiments (except for the 30 cm beaker, tested in still
air) covered a wide range of wind velocities (in most cases 2-15 km/h), the temperature
varying from 10°C to 19°C. In spite of this, the range of k u kj values was fairly narrow in
five cases out of seven — 0.43 to 0.49 cm/h, with an average of 0.46 cm/hr.
cm/hr
1.21.0
0.40.2!
i
0T
1 —r—1—r= 25°C
A yS
•
T—1—1—1—r
LEGEND
h=30 cm a
h=45 cm A
h = 90 cm ·
-1—\—1—1—1—1—1
'
0
5
10
15
WIND VELOCITY u (km/hr)
Fig. 6.
Effect of wind velocity on ammonia release (wind tunnel experiment).
The calculated coefficients of ammonia release rate in the wind tunnel experiments are
plotted in Fig. 6, which shows linearity between the product k u kj and wind velocity. The
diagram shows that in still air, and for the temperature range in question (23°-26°C,
average about 25°C), the product k u kj averages 0.18 for the three depths. In the case of
still air and no mixing, the wateV-air interface remains smooth and the partial pressure of
the ammonia over it is high. It may be assumed that under these conditions, upward
migration of the ammonia molecules within the water body and in the overlaying air is
due to molecular diffusion and thermal convection only. As the coefficient ki represents
the temperature, we have kj = 0.18 at 25°C. The average slope of the line in Fig. 6 is
0.074, hence: