

462
A.S. Anderson and R.C. Hanson
before changes in layer parameters occur. The position of the solid-liquid interface is
computed from the volumetric changes in the layers. The model must be evaluated on a
high speed digital computer for practical use as the number of calculations required are
enormous if good correlation between predicted and test results are to be obtained.
The program presented in Appendix A is an organized scheme for studying the
behavior of each layer throughout the settling test and to interpret the test for the
purpose of predicting the performance of a liquid solids separation unit.
PARAMETRIC STUDIES
The computer program presented in Appendix A was used to evaluate the effects of
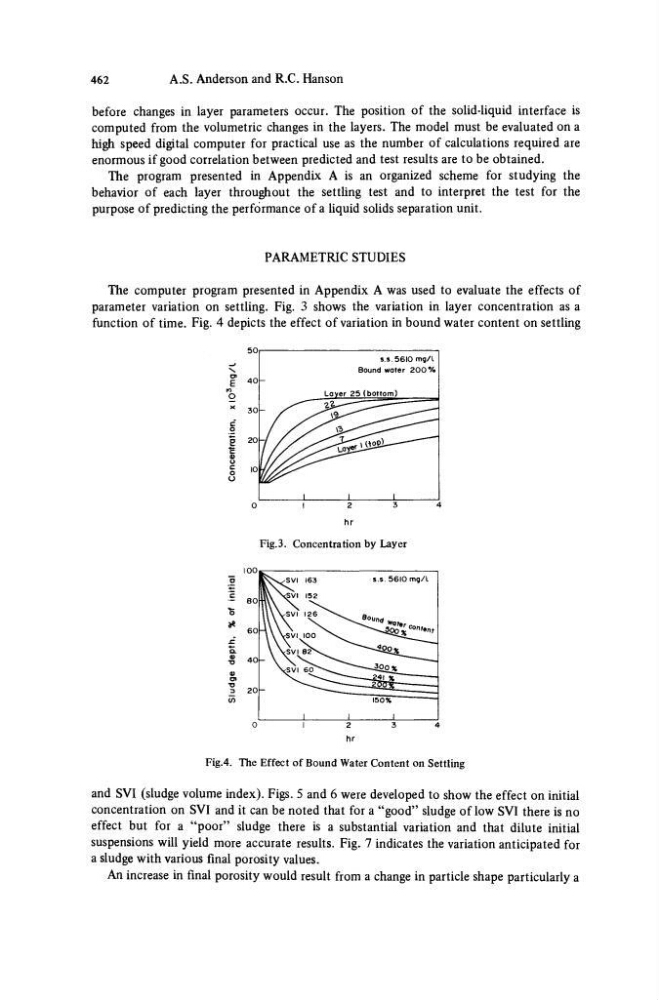
parameter variation on settling. Fig. 3 shows the variation in layer concentration as a
function of time. Fig. 4 depicts the effect of variation in bound water content on settling
E
fO
O
50,
30
7 //
s.s 5610 mg/l
Bound water 2 0 0 %
Layer 25 (bottom)
1
1
1
2
hr
Fig. 3. Concentration by Layer
40h
-
S^SVI 163
\ S V I 152
VSVI 126 ^^*s
y YSVI 100 ^ V ,
\svi e K .
\SVI 6 0 \ ^
1
s.s. 5610 mg/L
4 £ 0 * ^
150%
—"
i
1
2
hr
Fig.4. The Effect of Bound Water Content on Settling
and SVI (sludge volume index). Figs. 5 and 6 were developed to show the effect on initial
concentration on SVI and it can be noted that for a "good" sludge of low SVI there is no
effect but for a "poor" sludge there is a substantial variation and that dilute initial
suspensions will yield more accurate results. Fig. 7 indicates the variation anticipated for
a sludge with various final porosity values.
An increase in final porosity would result from a change in particle shape particularly a
A.S. Anderson and R.C. Hanson
before changes in layer parameters occur. The position of the solid-liquid interface is
computed from the volumetric changes in the layers. The model must be evaluated on a
high speed digital computer for practical use as the number of calculations required are
enormous if good correlation between predicted and test results are to be obtained.
The program presented in Appendix A is an organized scheme for studying the
behavior of each layer throughout the settling test and to interpret the test for the
purpose of predicting the performance of a liquid solids separation unit.
PARAMETRIC STUDIES
The computer program presented in Appendix A was used to evaluate the effects of
parameter variation on settling. Fig. 3 shows the variation in layer concentration as a
function of time. Fig. 4 depicts the effect of variation in bound water content on settling
E
fO
O
50,
30
7 //
s.s 5610 mg/l
Bound water 2 0 0 %
Layer 25 (bottom)
1
1
1
2
hr
Fig. 3. Concentration by Layer
40h
-
S^SVI 163
\ S V I 152
VSVI 126 ^^*s
y YSVI 100 ^ V ,
\svi e K .
\SVI 6 0 \ ^
1
s.s. 5610 mg/L
4 £ 0 * ^
150%
—"
i
1
2
hr
Fig.4. The Effect of Bound Water Content on Settling
and SVI (sludge volume index). Figs. 5 and 6 were developed to show the effect on initial
concentration on SVI and it can be noted that for a "good" sludge of low SVI there is no
effect but for a "poor" sludge there is a substantial variation and that dilute initial
suspensions will yield more accurate results. Fig. 7 indicates the variation anticipated for
a sludge with various final porosity values.
An increase in final porosity would result from a change in particle shape particularly a