

Structure of Turbulence and Oxygen Transfer Mechanism
449
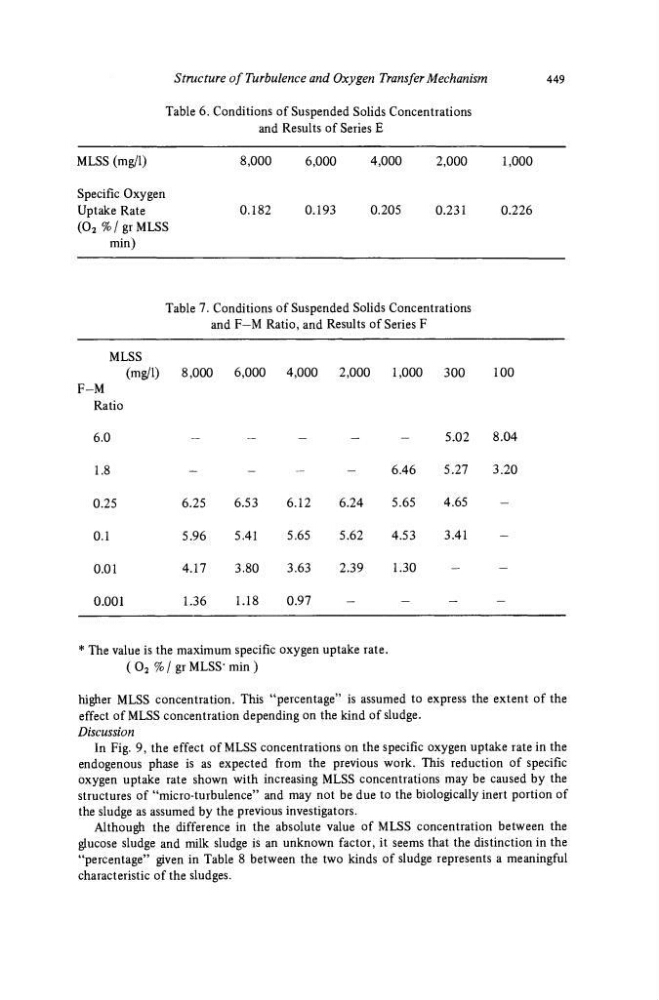
Table 6. Conditions of Suspended Solids Concentrations
and Results of Series E
MLSS(mg/l)
8,000
6,000
4,000
2,000
1,000
Specific Oxygen
Uptake Rate
0.182
0.193
0.205
0.231
0.226
(0 2 %/grMLSS
min)
Table 7. Conditions of Suspended Solids Concentrations
and F—M Ratio, and Results of Series F
MLSS
(mg/1)
8,000
6,000
4,000
2,000
F-M
Ratio
6.0
-
1.8
-
0.25
6.25
6.53
6.12
6.24
0.1
5.96
5.41
5.65
5.62
0.01
4.17
3.80
3.63
2.39
0.001
1.36
1.18
0.97
* The value is the maximum specific oxygen uptake rate.
( 0 2 % / gr MLSS' min )
higher MLSS concentration. This "percentage" is assumed to express the extent of the
effect of MLSS concentration depending on the kind of sludge.
Discussion
In Fig. 9, the effect of MLSS concentrations on the specific oxygen uptake rate in the
endogenous phase is as expected from the previous work. This reduction of specific
oxygen uptake rate shown with increasing MLSS concentrations may be caused by the
structures of "micro-turbulence" and may not be due to the biologically inert portion of
the sludge as assumed by the previous investigators.
Although the difference in the absolute value of MLSS concentration between the
glucose sludge and milk sludge is an unknown factor, it seems that the distinction in the
"percentage" given in Table 8 between the two kinds of sludge represents a meaningful
characteristic of the sludges.
1,000
6.46
5.65
4.53
1.30
300
5.02
5.27
4.65
3.41
100
8.04
3.20
449
Table 6. Conditions of Suspended Solids Concentrations
and Results of Series E
MLSS(mg/l)
8,000
6,000
4,000
2,000
1,000
Specific Oxygen
Uptake Rate
0.182
0.193
0.205
0.231
0.226
(0 2 %/grMLSS
min)
Table 7. Conditions of Suspended Solids Concentrations
and F—M Ratio, and Results of Series F
MLSS
(mg/1)
8,000
6,000
4,000
2,000
F-M
Ratio
6.0
-
1.8
-
0.25
6.25
6.53
6.12
6.24
0.1
5.96
5.41
5.65
5.62
0.01
4.17
3.80
3.63
2.39
0.001
1.36
1.18
0.97
* The value is the maximum specific oxygen uptake rate.
( 0 2 % / gr MLSS' min )
higher MLSS concentration. This "percentage" is assumed to express the extent of the
effect of MLSS concentration depending on the kind of sludge.
Discussion
In Fig. 9, the effect of MLSS concentrations on the specific oxygen uptake rate in the
endogenous phase is as expected from the previous work. This reduction of specific
oxygen uptake rate shown with increasing MLSS concentrations may be caused by the
structures of "micro-turbulence" and may not be due to the biologically inert portion of
the sludge as assumed by the previous investigators.
Although the difference in the absolute value of MLSS concentration between the
glucose sludge and milk sludge is an unknown factor, it seems that the distinction in the
"percentage" given in Table 8 between the two kinds of sludge represents a meaningful
characteristic of the sludges.
1,000
6.46
5.65
4.53
1.30
300
5.02
5.27
4.65
3.41
100
8.04
3.20