

Structure of Turbulence and Oxygen Transfer Mechanism
447
,Rubber Cap
Oxygerl
Cence J
Magnet
DO
Meter
Pen
Recorder
= V
Magnetic Stirrer
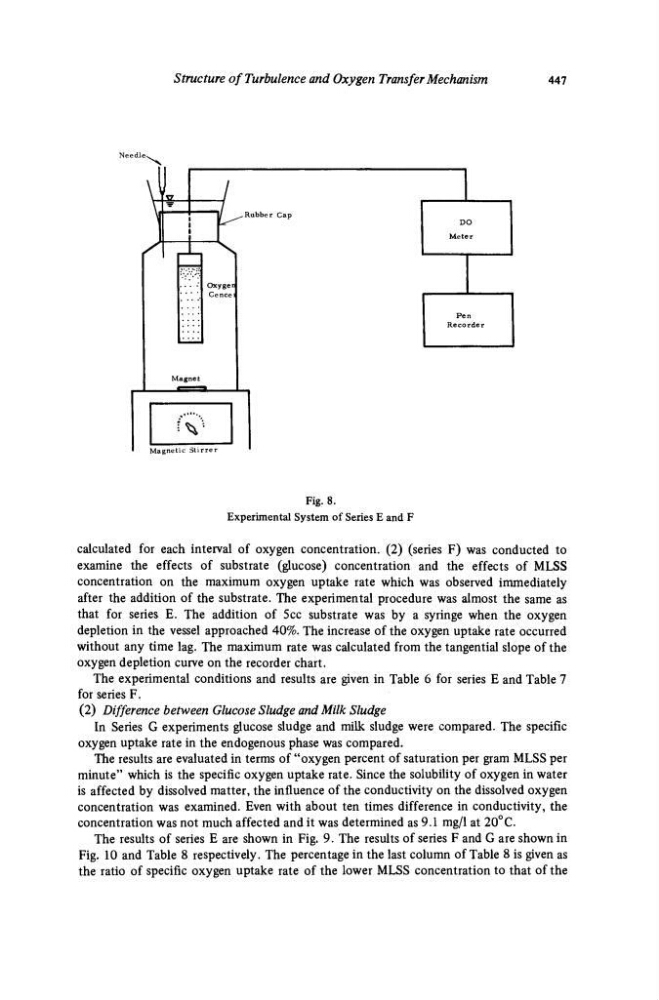
Fig. 8.
Experimental System of Series E and F
calculated for each interval of oxygen concentration. (2) (series F) was conducted to
examine the effects of substrate (glucose) concentration and the effects of MLSS
concentration on the maximum oxygen uptake rate which was observed immediately
after the addition of the substrate. The experimental procedure was almost the same as
that for series E. The addition of 5cc substrate was by a syringe when the oxygen
depletion in the vessel approached 40%. The increase of the oxygen uptake rate occurred
without any time lag. The maximum rate was calculated from the tangential slope of the
oxygen depletion curve on the recorder chart.
The experimental conditions and results are given in Table 6 for series E and Table 7
for series F.
(2) Difference between Glucose Sludge and Milk Sludge
In Series G experiments glucose sludge and milk sludge were compared. The specific
oxygen uptake rate in the endogenous phase was compared.
The results are evaluated in terms of "oxygen percent of saturation per gram MLSS per
minute" which is the specific oxygen uptake rate. Since the solubility of oxygen in water
is affected by dissolved matter, the influence of the conductivity on the dissolved oxygen
concentration was examined. Even with about ten times difference in conductivity, the
concentration was not much affected and it was determined as 9.1 mg/1 at 20°C.
The results of series E are shown in Fig. 9. The results of series F and G are shown in
Fig. 10 and Table 8 respectively. The percentage in the last column of Table 8 is given as
the ratio of specific oxygen uptake rate of the lower MLSS concentration to that of the
447
,Rubber Cap
Oxygerl
Cence J
Magnet
DO
Meter
Pen
Recorder
= V
Magnetic Stirrer
Fig. 8.
Experimental System of Series E and F
calculated for each interval of oxygen concentration. (2) (series F) was conducted to
examine the effects of substrate (glucose) concentration and the effects of MLSS
concentration on the maximum oxygen uptake rate which was observed immediately
after the addition of the substrate. The experimental procedure was almost the same as
that for series E. The addition of 5cc substrate was by a syringe when the oxygen
depletion in the vessel approached 40%. The increase of the oxygen uptake rate occurred
without any time lag. The maximum rate was calculated from the tangential slope of the
oxygen depletion curve on the recorder chart.
The experimental conditions and results are given in Table 6 for series E and Table 7
for series F.
(2) Difference between Glucose Sludge and Milk Sludge
In Series G experiments glucose sludge and milk sludge were compared. The specific
oxygen uptake rate in the endogenous phase was compared.
The results are evaluated in terms of "oxygen percent of saturation per gram MLSS per
minute" which is the specific oxygen uptake rate. Since the solubility of oxygen in water
is affected by dissolved matter, the influence of the conductivity on the dissolved oxygen
concentration was examined. Even with about ten times difference in conductivity, the
concentration was not much affected and it was determined as 9.1 mg/1 at 20°C.
The results of series E are shown in Fig. 9. The results of series F and G are shown in
Fig. 10 and Table 8 respectively. The percentage in the last column of Table 8 is given as
the ratio of specific oxygen uptake rate of the lower MLSS concentration to that of the