

440
T. Matsuo
The laboratory aeration tank which was used in this experiment is shown schematically in Fig. 1. The volume of water is 35 1. Baffle plates could be installed in the
aeration tank and restrict the flow region to a defined width. The diffuser was a sintered
stylene porous one. A current meter with an effective range from 2 cm/sec, to 30 cm/sec
was provided.
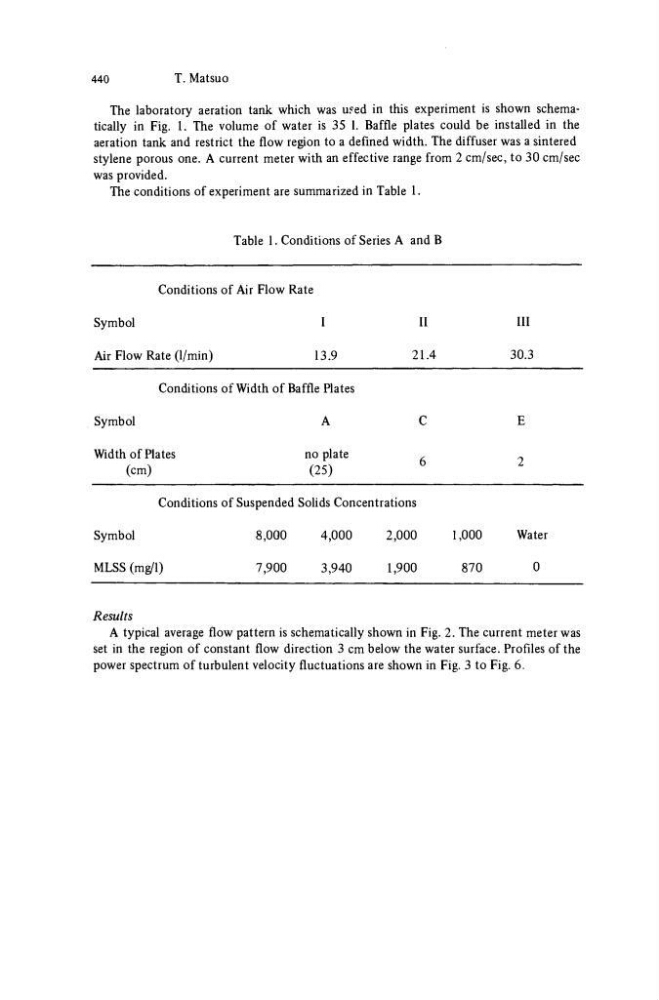
The conditions of experiment are summarized in Table 1.
Table 1. Conditions of Series A and B
Conditions of Air Flow Rate
Symbol
I
II
III
Air Flow Rate (1/min)
13.9
21.4
30.3
Conditions of Width of Baffle Plates
Symbol
A
C
E
Width of Plates
no plate
.
9
(cm)
(25)
Conditions of Suspended Solids Concentrations
Symbol
8,000
4,000
2,000
1,000
Water
MLSS(mg/l)
7,900
3,940
1,900
870
0
Results
A typical average flow pattern is schematically shown in Fig. 2. The current meter was
set in the region of constant flow direction 3 cm below the water surface. Profiles of the
power spectrum of turbulent velocity fluctuations are shown in Fig. 3 to Fig. 6.
T. Matsuo
The laboratory aeration tank which was used in this experiment is shown schematically in Fig. 1. The volume of water is 35 1. Baffle plates could be installed in the
aeration tank and restrict the flow region to a defined width. The diffuser was a sintered
stylene porous one. A current meter with an effective range from 2 cm/sec, to 30 cm/sec
was provided.
The conditions of experiment are summarized in Table 1.
Table 1. Conditions of Series A and B
Conditions of Air Flow Rate
Symbol
I
II
III
Air Flow Rate (1/min)
13.9
21.4
30.3
Conditions of Width of Baffle Plates
Symbol
A
C
E
Width of Plates
no plate
.
9
(cm)
(25)
Conditions of Suspended Solids Concentrations
Symbol
8,000
4,000
2,000
1,000
Water
MLSS(mg/l)
7,900
3,940
1,900
870
0
Results
A typical average flow pattern is schematically shown in Fig. 2. The current meter was
set in the region of constant flow direction 3 cm below the water surface. Profiles of the
power spectrum of turbulent velocity fluctuations are shown in Fig. 3 to Fig. 6.