

Uncertainty in Interpreting Biological Growth Rates
343
square of the raw data about the model.
Decisions concerning the acceptance or rejection of a parameter in a model and of the
model as an adequate description of the data were inferred from the F statistic (at the
95% confidence level) based on the error mean square. The latter quantity was estimated
from the replicate measurements for 50 levels of the dependent variable (either C c or Cß)
equally spaced over the spectrum of levels used in this investigation. The error variance
was observed to be independent of the magnitude of the untransformed raw data.
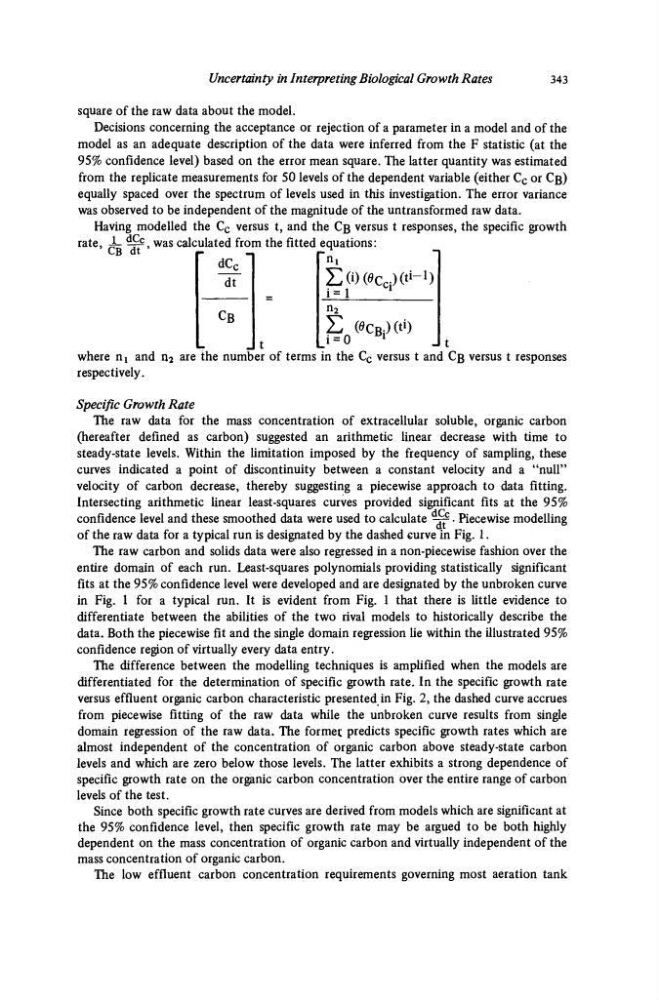
Having modelled the C c versus t, and the Cß versus t responses, the specific growth
rate, ±- ^ 9 was calculated from the fitted equations:
Γ AC. Ί
ΓΠι
EoxecqXt
1
-
1
)
Σ («CftM*
1
)
i = 0
ö l
where n! and n^ are the number of terms in the C c versus t and Cß versus t responses
respectively.
Γ dC c "
dt
c B
L.
β It
I
Specific Growth Rate
The raw data for the mass concentration of extracellular soluble, organic carbon
(hereafter defined as carbon) suggested an arithmetic linear decrease with time to
steady-state levels. Within the limitation imposed by the frequency of sampling, these
curves indicated a point of discontinuity between a constant velocity and a "null"
velocity of carbon decrease, thereby suggesting a piecewise approach to data fitting.
Intersecting arithmetic linear least-squares curves provided significant fits at the 95%
confidence level and these smoothed data were used to calculate ^ - . Piecewise modelling
of the raw data for a typical run is designated by the dashed curve in Fig. 1.
The raw carbon and solids data were also regressed in a non-piecewise fashion over the
entire domain of each run. Least-squares polynomials providing statistically significant
fits at the 95% confidence level were developed and are designated by the unbroken curve
in Fig. 1 for a typical run. It is evident from Fig. 1 that there is little evidence to
differentiate between the abilities of the two rival models to historically describe the
data. Both the piecewise fit and the single domain regression lie within the illustrated 95%
confidence region of virtually every data entry.
The difference between the modelling techniques is amplified when the models are
differentiated for the determination of specific growth rate. In the specific growth rate
versus effluent organic carbon characteristic presented in Fig. 2, the dashed curve accrues
from piecewise fitting of the raw data while the unbroken curve results from single
domain regression of the raw data. The former, predicts specific growth rates which are
almost independent of the concentration of organic carbon above steady-state carbon
levels and which are zero below those levels. The latter exhibits a strong dependence of
specific growth rate on the organic carbon concentration over the entire range of carbon
levels of the test.
Since both specific growth rate curves are derived from models which are significant at
the 95% confidence level, then specific growth rate may be argued to be both highly
dependent on the mass concentration of organic carbon and virtually independent of the
mass concentration of organic carbon.
The low effluent carbon concentration requirements governing most aeration tank
343
square of the raw data about the model.
Decisions concerning the acceptance or rejection of a parameter in a model and of the
model as an adequate description of the data were inferred from the F statistic (at the
95% confidence level) based on the error mean square. The latter quantity was estimated
from the replicate measurements for 50 levels of the dependent variable (either C c or Cß)
equally spaced over the spectrum of levels used in this investigation. The error variance
was observed to be independent of the magnitude of the untransformed raw data.
Having modelled the C c versus t, and the Cß versus t responses, the specific growth
rate, ±- ^ 9 was calculated from the fitted equations:
Γ AC. Ί
ΓΠι
EoxecqXt
1
-
1
)
Σ («CftM*
1
)
i = 0
ö l
where n! and n^ are the number of terms in the C c versus t and Cß versus t responses
respectively.
Γ dC c "
dt
c B
L.
β It
I
Specific Growth Rate
The raw data for the mass concentration of extracellular soluble, organic carbon
(hereafter defined as carbon) suggested an arithmetic linear decrease with time to
steady-state levels. Within the limitation imposed by the frequency of sampling, these
curves indicated a point of discontinuity between a constant velocity and a "null"
velocity of carbon decrease, thereby suggesting a piecewise approach to data fitting.
Intersecting arithmetic linear least-squares curves provided significant fits at the 95%
confidence level and these smoothed data were used to calculate ^ - . Piecewise modelling
of the raw data for a typical run is designated by the dashed curve in Fig. 1.
The raw carbon and solids data were also regressed in a non-piecewise fashion over the
entire domain of each run. Least-squares polynomials providing statistically significant
fits at the 95% confidence level were developed and are designated by the unbroken curve
in Fig. 1 for a typical run. It is evident from Fig. 1 that there is little evidence to
differentiate between the abilities of the two rival models to historically describe the
data. Both the piecewise fit and the single domain regression lie within the illustrated 95%
confidence region of virtually every data entry.
The difference between the modelling techniques is amplified when the models are
differentiated for the determination of specific growth rate. In the specific growth rate
versus effluent organic carbon characteristic presented in Fig. 2, the dashed curve accrues
from piecewise fitting of the raw data while the unbroken curve results from single
domain regression of the raw data. The former, predicts specific growth rates which are
almost independent of the concentration of organic carbon above steady-state carbon
levels and which are zero below those levels. The latter exhibits a strong dependence of
specific growth rate on the organic carbon concentration over the entire range of carbon
levels of the test.
Since both specific growth rate curves are derived from models which are significant at
the 95% confidence level, then specific growth rate may be argued to be both highly
dependent on the mass concentration of organic carbon and virtually independent of the
mass concentration of organic carbon.
The low effluent carbon concentration requirements governing most aeration tank