

Self-Purification in Sewers
297
AD
1
*
1
mjfi
T
9
M
1
1
| . ,
d
E
h m
l\\
π
• ^ J O T *
H.
^ r
N»
C u r v e
A
B
C
D
E
~ F
.£_
B
A
H
Sewage
Fresh resiaential
Fresh residential
Matured residentia
Metropolitan trunk
Metropolitan trunk
Metropolitan trunk
a"Γ~*
w
i
t
|
ί — ■ —
^
Temp.
e
C
19°
19° J
20° Ί
2\°
26
e
22
e H
j
•
0
4
8
12
16
2 0
2 4
Hours
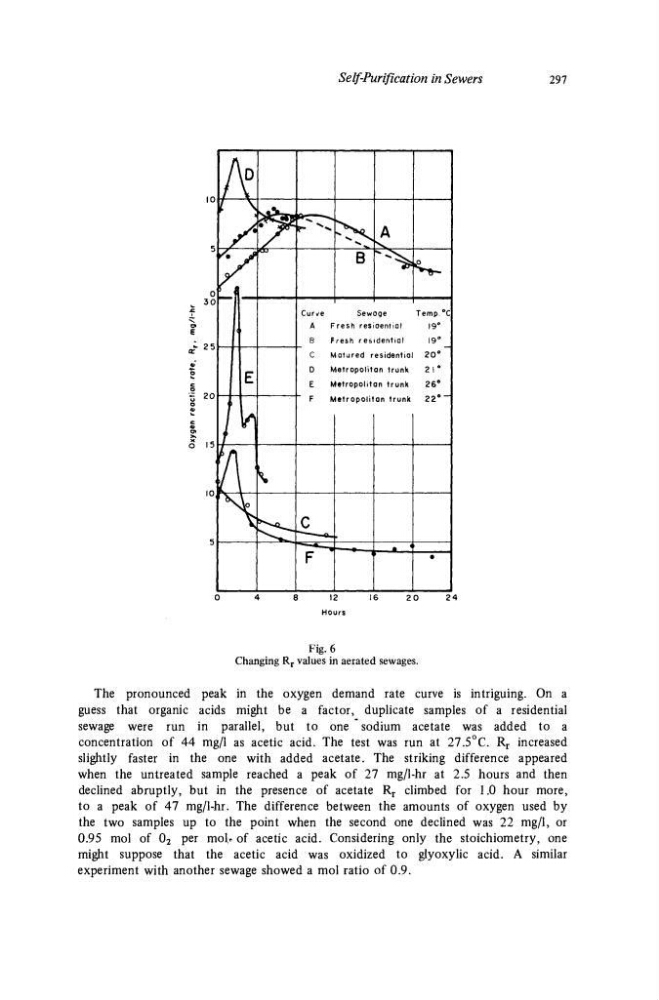
Fig. 6
Changing R r values in aerated sewages.
The pronounced peak in the oxygen demand rate curve is intriguing. On a
guess that organic acids might be a factor, duplicate samples of a residential
sewage were run in parallel, but to one sodium acetate was added to a
concentration of 44 mg/1 as acetic acid. The test was run at 27.5°C. R r increased
slightly faster in the one with added acetate. The striking difference appeared
when the untreated sample reached a peak of 27 mg/l-hr at 2.5 hours and then
declined abruptly, but in the presence of acetate R r climbed for 1.0 hour more,
to a peak of 47 mg/l-hr. The difference between the amounts of oxygen used by
the two samples up to the point when the second one declined was 22 mg/1, or
0.95 mol of 0 2 per molr of acetic acid. Considering only the stoichiometry, one
might suppose that the acetic acid was oxidized to glyoxylic acid. A similar
experiment with another sewage showed a mol ratio of 0.9.
297
AD
1
*
1
mjfi
T
9
M
1
1
| . ,
d
E
h m
l\\
π
• ^ J O T *
H.
^ r
N»
C u r v e
A
B
C
D
E
~ F
.£_
B
A
H
Sewage
Fresh resiaential
Fresh residential
Matured residentia
Metropolitan trunk
Metropolitan trunk
Metropolitan trunk
a"Γ~*
w
i
t
|
ί — ■ —
^
Temp.
e
C
19°
19° J
20° Ί
2\°
26
e
22
e H
j
•
0
4
8
12
16
2 0
2 4
Hours
Fig. 6
Changing R r values in aerated sewages.
The pronounced peak in the oxygen demand rate curve is intriguing. On a
guess that organic acids might be a factor, duplicate samples of a residential
sewage were run in parallel, but to one sodium acetate was added to a
concentration of 44 mg/1 as acetic acid. The test was run at 27.5°C. R r increased
slightly faster in the one with added acetate. The striking difference appeared
when the untreated sample reached a peak of 27 mg/l-hr at 2.5 hours and then
declined abruptly, but in the presence of acetate R r climbed for 1.0 hour more,
to a peak of 47 mg/l-hr. The difference between the amounts of oxygen used by
the two samples up to the point when the second one declined was 22 mg/1, or
0.95 mol of 0 2 per molr of acetic acid. Considering only the stoichiometry, one
might suppose that the acetic acid was oxidized to glyoxylic acid. A similar
experiment with another sewage showed a mol ratio of 0.9.