

A Quality Management Model for River and Underground Flow System
265
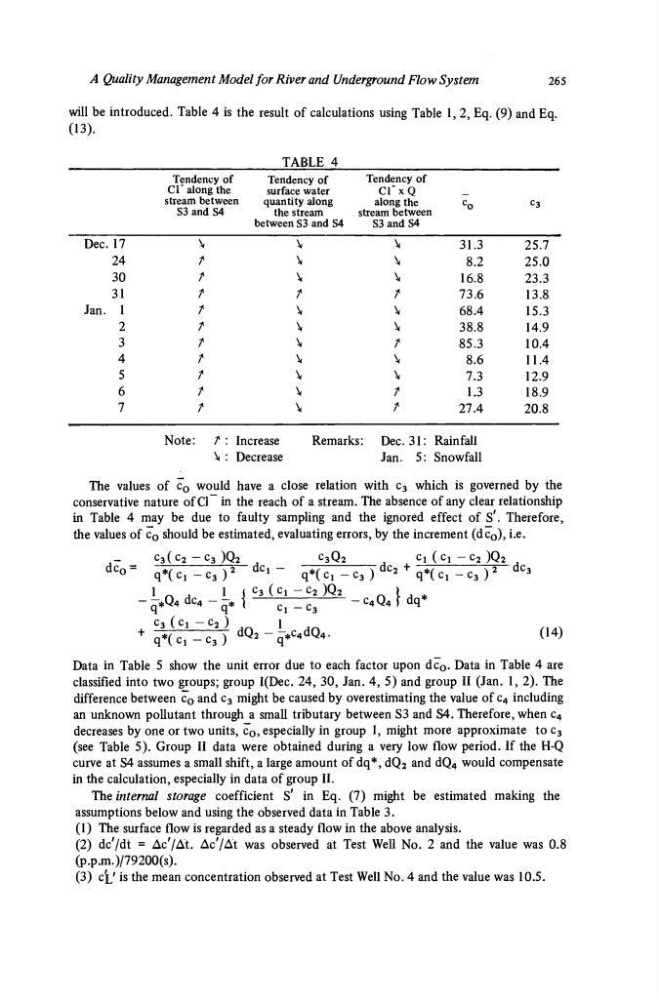
will be introduced. Table 4 is the result of calculations using Table 1, 2, Eq. (9) and Eq.
(13).
TABLE 4
Tendency of
Tendency of
Tendency of
Cl" along the
surface water
Cl" x Q
stream between
quantity along
along the
c Q
c 3
S3 and S4
the stream
stream between
between S3 and S4
S3 and S4
Dec. 17
24
30
31
Jan. 1
2
3
4
5
6
7
\
t
t
t
t
t
t
t
t
t
t
\
\
\
t
\
\
\
\
\
\
\
\
\
\
t
\
\
r
\
\
t
t
31.3
8.2
16.8
73.6
68.4
38.8
85.3
8.6
7.3
1.3
27.4
25.7
25.0
23.3
13.8
15.3
14.9
10.4
11.4
12.9
18.9
20.8
Note: T \ Increase
Remarks: Dec. 31: Rainfall
\ : Decrease
Jan. 5: Snowfall
The values of c 0 would have a close relation with c 3 which is governed by the
conservative nature ofCl" in the reach of a stream. The absence of any clear relationship
in Table 4 may be due to faulty sampling and the ignored effect of S\ Therefore,
the values of c 0 should be estimated, evaluating errors, by the increment (dc 0 ), i.e.
c 3 ( c 2 - c 3 ) Q 2 Λ
c 3 Q 2
Cx (ci - c 2 )Q 2 ,
d C o =
q ^ c x - c , )
2
d c ^
q * ( c 1 - c 3 )
d c 2 + q * ( c 1 - c 3 )
2
dc 3
1 ΓΛ Λ
l
i
C 3 (
C 1 ~
C 2 ) Q 2
n
\ A ^
- -*Q4 dc 4 - -* \
Ci _ C 3
- c 4 Q 4 f dq*
c 3 (cj — c 2 )
i
+ q * ( C l - c 3 )
d Q 2 " q*
c 4
d Q4·
(14)
Data in Table 5 show the unit error due to each factor upon dc 0 . Data in Table 4 are
classified into two groups; group I(Dec. 24, 30, Jan. 4, 5) and group II (Jan. 1, 2). The
difference between c 0 and c 3 might be caused by overestimating the value of c 4 including
an unknown pollutant through a small tributary between S3 and S4. Therefore, when c 4
decreases by one or two units, c 0 , especially in group I, might more approximate to c 3
(see Table 5). Group II data were obtained during a very low flow period. If the H-Q
curve at S4 assumes a small shift, a large amount of dq*, dQ 2 and dQ 4 would compensate
in the calculation, especially in data of group II.
The internal storage coefficient S' in Eq. (7) might be estimated making the
assumptions below and using the observed data in Table 3.
(1) The surface flow is regarded as a steady flow in the above analysis.
(2) dc'/dt = Ac'/At. Ac'/At was observed at Test Well No. 2 and the value was 0.8
(p.pjn.)/79200(s).
(3) CL' is the mean concentration observed at Test Well No. 4 and the value was 10.5.
265
will be introduced. Table 4 is the result of calculations using Table 1, 2, Eq. (9) and Eq.
(13).
TABLE 4
Tendency of
Tendency of
Tendency of
Cl" along the
surface water
Cl" x Q
stream between
quantity along
along the
c Q
c 3
S3 and S4
the stream
stream between
between S3 and S4
S3 and S4
Dec. 17
24
30
31
Jan. 1
2
3
4
5
6
7
\
t
t
t
t
t
t
t
t
t
t
\
\
\
t
\
\
\
\
\
\
\
\
\
\
t
\
\
r
\
\
t
t
31.3
8.2
16.8
73.6
68.4
38.8
85.3
8.6
7.3
1.3
27.4
25.7
25.0
23.3
13.8
15.3
14.9
10.4
11.4
12.9
18.9
20.8
Note: T \ Increase
Remarks: Dec. 31: Rainfall
\ : Decrease
Jan. 5: Snowfall
The values of c 0 would have a close relation with c 3 which is governed by the
conservative nature ofCl" in the reach of a stream. The absence of any clear relationship
in Table 4 may be due to faulty sampling and the ignored effect of S\ Therefore,
the values of c 0 should be estimated, evaluating errors, by the increment (dc 0 ), i.e.
c 3 ( c 2 - c 3 ) Q 2 Λ
c 3 Q 2
Cx (ci - c 2 )Q 2 ,
d C o =
q ^ c x - c , )
2
d c ^
q * ( c 1 - c 3 )
d c 2 + q * ( c 1 - c 3 )
2
dc 3
1 ΓΛ Λ
l
i
C 3 (
C 1 ~
C 2 ) Q 2
n
\ A ^
- -*Q4 dc 4 - -* \
Ci _ C 3
- c 4 Q 4 f dq*
c 3 (cj — c 2 )
i
+ q * ( C l - c 3 )
d Q 2 " q*
c 4
d Q4·
(14)
Data in Table 5 show the unit error due to each factor upon dc 0 . Data in Table 4 are
classified into two groups; group I(Dec. 24, 30, Jan. 4, 5) and group II (Jan. 1, 2). The
difference between c 0 and c 3 might be caused by overestimating the value of c 4 including
an unknown pollutant through a small tributary between S3 and S4. Therefore, when c 4
decreases by one or two units, c 0 , especially in group I, might more approximate to c 3
(see Table 5). Group II data were obtained during a very low flow period. If the H-Q
curve at S4 assumes a small shift, a large amount of dq*, dQ 2 and dQ 4 would compensate
in the calculation, especially in data of group II.
The internal storage coefficient S' in Eq. (7) might be estimated making the
assumptions below and using the observed data in Table 3.
(1) The surface flow is regarded as a steady flow in the above analysis.
(2) dc'/dt = Ac'/At. Ac'/At was observed at Test Well No. 2 and the value was 0.8
(p.pjn.)/79200(s).
(3) CL' is the mean concentration observed at Test Well No. 4 and the value was 10.5.