

124
C. Wallis and J.L. Melnick
FIGURE 4
1 0
stock
poliovirus
Average No.
P F U / 0 . 1 ml
No. PFU per
total volume
3 0
5 ml of 10
stock virus added
to 5 gallons of treated water
(salt-dye-thiosulfate)
3 gallons of the virus-salt-dyethiosulfate mixture injected into
3 0 0 gallons of running tap water
at a 1:100 dilution
(1500)
( 9 0 0 )
Virus adsorbent treated with
eluent, and 1 6 0 0 ml eluate
assayed
1 6 0 0 ml eluate filtered through
cellulose membrane to adsorb
virus thereon, and virus eluted in
a 5 ml volume
10 ml eluate
7 0 0
(78%)
Virus too dilute to detect. The 1 5 0 0 PFU input is based on the control assay of 3 0 P F U / 0 . 1 ml.
Total virus passed through the adsorbent was 9 0 0 PFU.
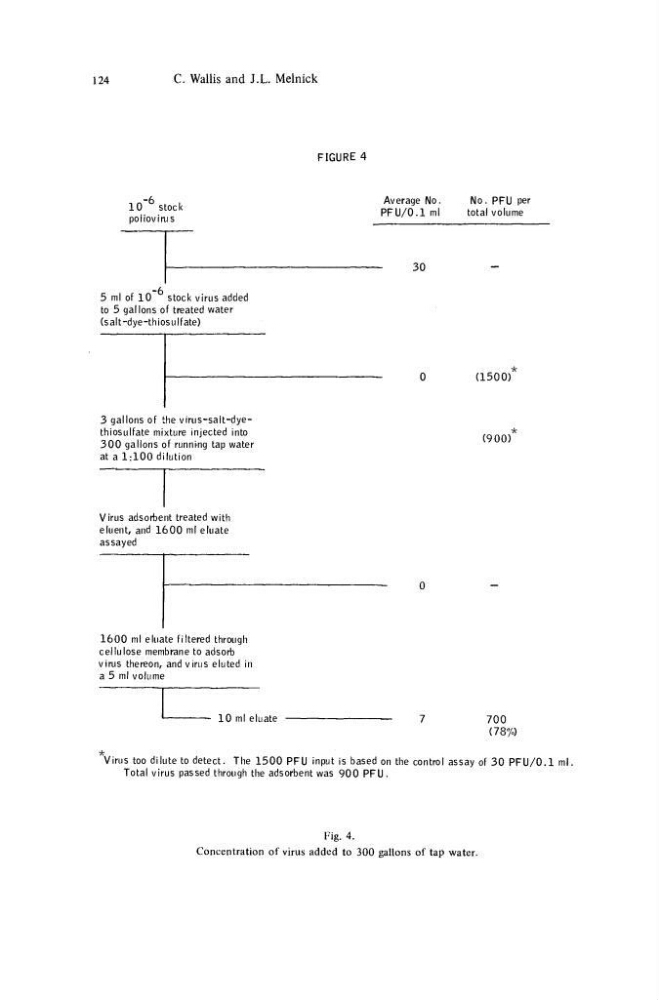
Fig. 4.
Concentration of virus added to 300 gallons of tap water.
C. Wallis and J.L. Melnick
FIGURE 4
1 0
stock
poliovirus
Average No.
P F U / 0 . 1 ml
No. PFU per
total volume
3 0
5 ml of 10
stock virus added
to 5 gallons of treated water
(salt-dye-thiosulfate)
3 gallons of the virus-salt-dyethiosulfate mixture injected into
3 0 0 gallons of running tap water
at a 1:100 dilution
(1500)
( 9 0 0 )
Virus adsorbent treated with
eluent, and 1 6 0 0 ml eluate
assayed
1 6 0 0 ml eluate filtered through
cellulose membrane to adsorb
virus thereon, and virus eluted in
a 5 ml volume
10 ml eluate
7 0 0
(78%)
Virus too dilute to detect. The 1 5 0 0 PFU input is based on the control assay of 3 0 P F U / 0 . 1 ml.
Total virus passed through the adsorbent was 9 0 0 PFU.
Fig. 4.
Concentration of virus added to 300 gallons of tap water.