

Wind
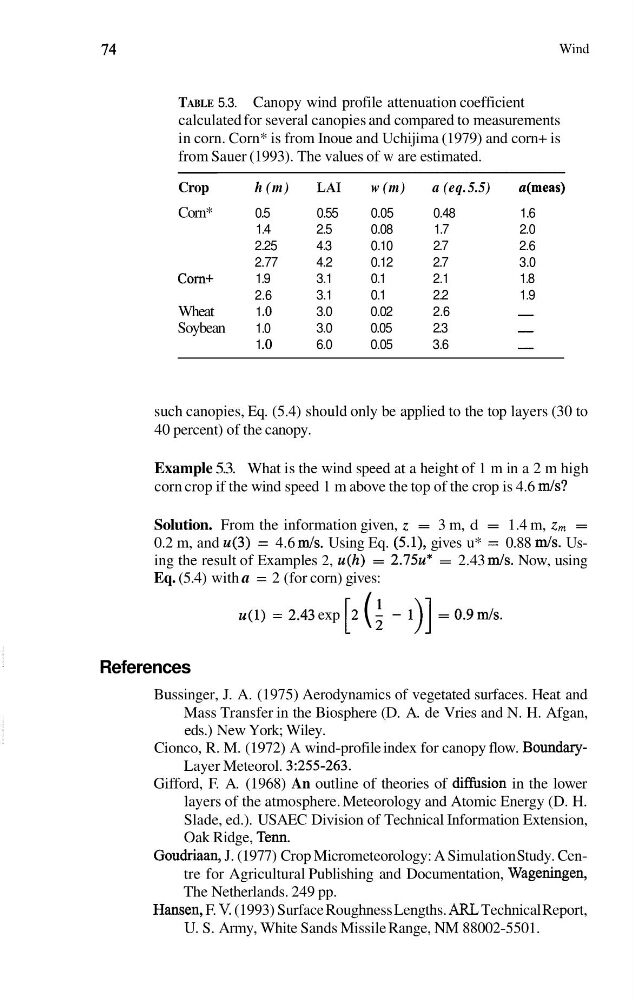
TABLE 5.3. Canopy wind profile attenuation coefficient
calculated for several canopies and compared to measurements
in corn. Corn* is from Inoue and Uchijima (1979) and corn+ is
from Sauer (1993). The values of w are estimated.
Crop
h (m)
LA1
w (m)
a (eq. 5.5)
a(meas)
Corn*
0.5
0.55
0.05
0.48
1.6
1.4
2.5
0.08
1.7
2.0
2.25
4.3
0.10
2.7
2.6
2.77
4.2
0.12
2.7
3.0
Corn+
1.9
3.1
0.1
2.1
1.8
2.6
3.1
0.1
2.2
1.9
Wheat
1 .O
3.0
0.02
2.6
-
Soybean
1.0
3.0
0.05
2.3
-
1 .O
6.0
0.05
3.6
-
such canopies, Eq. (5.4) should only be applied to the top layers (30 to
40 percent) of the canopy.
Example 5.3. What is the wind speed at a height of 1 m in a 2 m high
corn crop if the wind speed 1 m above the top of the crop is 4.6 d s ?
Solution. From the information given, z = 3 m, d = 1.4 m, z , =
0.2 m, and u(3) = 4.6 d s . Using Eq. (5.1), gives u* = 0.88 d s . Using the result of Examples 2, u(h) = 2.75u* = 2.43 d s . Now, using
Eq. (5.4) with a = 2 (for corn) gives:
u(1) = 2.43 exp [2 ( f - l)] = 0 . 9 d s .
References
Bussinger, J. A. (1975) Aerodynamics of vegetated surfaces. Heat and
Mass Transfer in the Biosphere (D. A. de Vries and N. H. Afgan,
eds.) New York; Wiley.
Cionco, R. M. (1972) A wind-profile index for canopy flow. BoundaryLayer Meteorol. 3:255-263.
Gifford, F. A. (1968) An outline of theories of diffusion in the lower
layers of the atmosphere. Meteorology and Atomic Energy (D. H.
Slade, ed.). USAEC Division of Technical Information Extension,
Oak Ridge, Term.
Goudriaan, J. (1977) Crop Micrometeorology: A Simulation Study. Centre for Agricultural Publishing and Documentation, Wageningen,
The Netherlands. 249 pp.
Hansen, F. V. (1993) Surface Roughness Lengths. ARL Technical Report,
U. S. Army, White Sands Missile Range, NM 88002-5501.
TABLE 5.3. Canopy wind profile attenuation coefficient
calculated for several canopies and compared to measurements
in corn. Corn* is from Inoue and Uchijima (1979) and corn+ is
from Sauer (1993). The values of w are estimated.
Crop
h (m)
LA1
w (m)
a (eq. 5.5)
a(meas)
Corn*
0.5
0.55
0.05
0.48
1.6
1.4
2.5
0.08
1.7
2.0
2.25
4.3
0.10
2.7
2.6
2.77
4.2
0.12
2.7
3.0
Corn+
1.9
3.1
0.1
2.1
1.8
2.6
3.1
0.1
2.2
1.9
Wheat
1 .O
3.0
0.02
2.6
-
Soybean
1.0
3.0
0.05
2.3
-
1 .O
6.0
0.05
3.6
-
such canopies, Eq. (5.4) should only be applied to the top layers (30 to
40 percent) of the canopy.
Example 5.3. What is the wind speed at a height of 1 m in a 2 m high
corn crop if the wind speed 1 m above the top of the crop is 4.6 d s ?
Solution. From the information given, z = 3 m, d = 1.4 m, z , =
0.2 m, and u(3) = 4.6 d s . Using Eq. (5.1), gives u* = 0.88 d s . Using the result of Examples 2, u(h) = 2.75u* = 2.43 d s . Now, using
Eq. (5.4) with a = 2 (for corn) gives:
u(1) = 2.43 exp [2 ( f - l)] = 0 . 9 d s .
References
Bussinger, J. A. (1975) Aerodynamics of vegetated surfaces. Heat and
Mass Transfer in the Biosphere (D. A. de Vries and N. H. Afgan,
eds.) New York; Wiley.
Cionco, R. M. (1972) A wind-profile index for canopy flow. BoundaryLayer Meteorol. 3:255-263.
Gifford, F. A. (1968) An outline of theories of diffusion in the lower
layers of the atmosphere. Meteorology and Atomic Energy (D. H.
Slade, ed.). USAEC Division of Technical Information Extension,
Oak Ridge, Term.
Goudriaan, J. (1977) Crop Micrometeorology: A Simulation Study. Centre for Agricultural Publishing and Documentation, Wageningen,
The Netherlands. 249 pp.
Hansen, F. V. (1993) Surface Roughness Lengths. ARL Technical Report,
U. S. Army, White Sands Missile Range, NM 88002-5501.