

Humans and their Environment
by drawing an equivalent electrical circuit like Fig. 12.1, with thermal
conductors being represented by electrical conductors, temperatures (heat
concentrations) by voltages, and heat flux densities by current sources or
sinks. The new diagram is like Fig. 12.1 except that the heat source in the
body is M - AE,, and an additional heat sink is added at the skin surface
equal to AE,. Writing the energy balance equation for this circuit gives
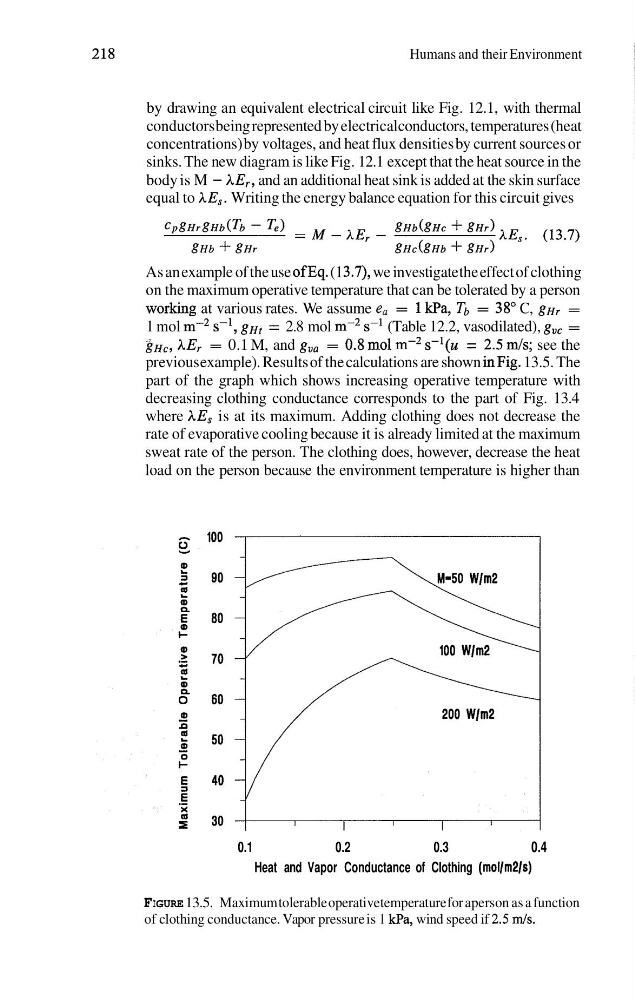
As an example of the use ofEq. (1 3.7), we investigate the effect of clothing
on the maximum operative temperature that can be tolerated by a person
working at various rates. We assume e, = 1 H a , Tb = 38O C, g ~ ,
=
1 mol m-2 s-' , g H r = 2.8 mol m-2 s-' (Table 12.2, vasodilated), g,, =
gHc, hE, = 0.1 M, and g,, = 0.8mol m-2 s-'(u = 2 . 5 d s ; see the
previous example). Results of the calculations are shown inFig. 13.5. The
part of the graph which shows increasing operative temperature with
decreasing clothing conductance corresponds to the part of Fig. 13.4
where AE, is at its maximum. Adding clothing does not decrease the
rate of evaporative cooling because it is already limited at the maximum
sweat rate of the person. The clothing does, however, decrease the heat
load on the person because the environment temperature is higher than
0.1
0.2
0.3
0.4
Heat and Vapor Conductance of Clothing (molIm2ls)
FIGURE 13.5. Maximum tolerable operative temperature for aperson as a function
of clothing conductance. Vapor pressure is 1 kPa, wind speed if 2.5 mls.
by drawing an equivalent electrical circuit like Fig. 12.1, with thermal
conductors being represented by electrical conductors, temperatures (heat
concentrations) by voltages, and heat flux densities by current sources or
sinks. The new diagram is like Fig. 12.1 except that the heat source in the
body is M - AE,, and an additional heat sink is added at the skin surface
equal to AE,. Writing the energy balance equation for this circuit gives
As an example of the use ofEq. (1 3.7), we investigate the effect of clothing
on the maximum operative temperature that can be tolerated by a person
working at various rates. We assume e, = 1 H a , Tb = 38O C, g ~ ,
=
1 mol m-2 s-' , g H r = 2.8 mol m-2 s-' (Table 12.2, vasodilated), g,, =
gHc, hE, = 0.1 M, and g,, = 0.8mol m-2 s-'(u = 2 . 5 d s ; see the
previous example). Results of the calculations are shown inFig. 13.5. The
part of the graph which shows increasing operative temperature with
decreasing clothing conductance corresponds to the part of Fig. 13.4
where AE, is at its maximum. Adding clothing does not decrease the
rate of evaporative cooling because it is already limited at the maximum
sweat rate of the person. The clothing does, however, decrease the heat
load on the person because the environment temperature is higher than
0.1
0.2
0.3
0.4
Heat and Vapor Conductance of Clothing (molIm2ls)
FIGURE 13.5. Maximum tolerable operative temperature for aperson as a function
of clothing conductance. Vapor pressure is 1 kPa, wind speed if 2.5 mls.