

Water Flow in Soil
0.0
0.1
0.2
0.3
0.4
0.5
Water Content (m3lm3)
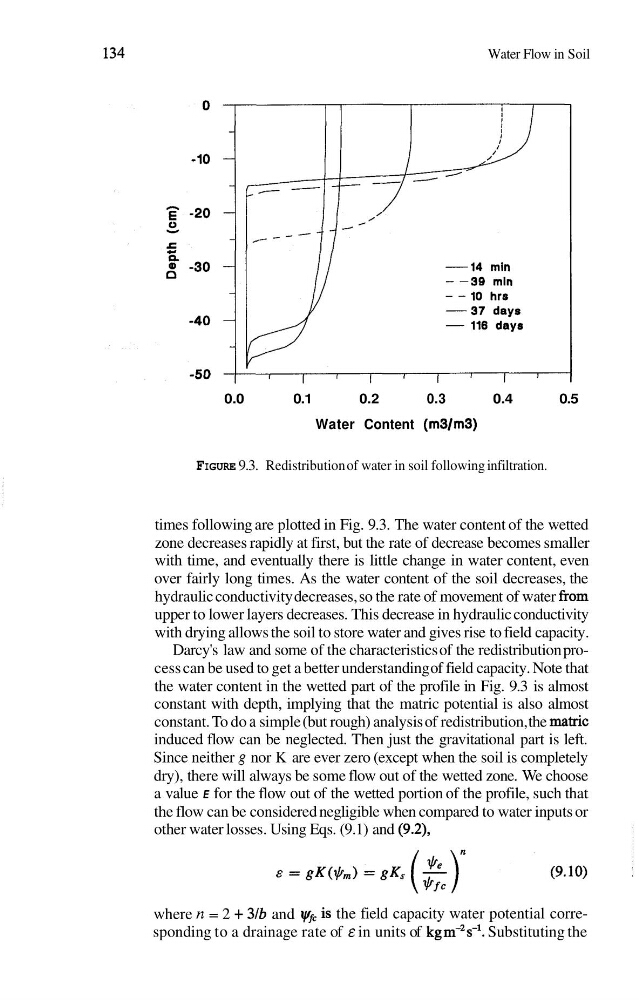
FIGURE 9.3. Redistribution of water in soil following infiltration.
times following are plotted in Fig. 9.3. The water content of the wetted
zone decreases rapidly at first, but the rate of decrease becomes smaller
with time, and eventually there is little change in water content, even
over fairly long times. As the water content of the soil decreases, the
hydraulic conductivity decreases, so the rate of movement of water from
upper to lower layers decreases. This decrease in hydraulic conductivity
with drying allows the soil to store water and gives rise to field capacity.
Darcy's law and some of the characteristics of the redistribution process can be used to get a better understanding of field capacity. Note that
the water content in the wetted part of the profile in Fig. 9.3 is almost
constant with depth, implying that the matric potential is also almost
constant. To do a simple (but rough) analysis of redistribution, the matric
induced flow can be neglected. Then just the gravitational part is left.
Since neither g nor K are ever zero (except when the soil is completely
dry), there will always be some flow out of the wetted zone. We choose
a value E for the flow out of the wetted portion of the profile, such that
the flow can be considered negligible when compared to water inputs or
other water losses. Using Eqs. (9.1) and (9.2),
where n = 2 + 3lb and is the field capacity water potential corresponding to a drainage rate of E in units of kgm%-'. Substituting the
0.0
0.1
0.2
0.3
0.4
0.5
Water Content (m3lm3)
FIGURE 9.3. Redistribution of water in soil following infiltration.
times following are plotted in Fig. 9.3. The water content of the wetted
zone decreases rapidly at first, but the rate of decrease becomes smaller
with time, and eventually there is little change in water content, even
over fairly long times. As the water content of the soil decreases, the
hydraulic conductivity decreases, so the rate of movement of water from
upper to lower layers decreases. This decrease in hydraulic conductivity
with drying allows the soil to store water and gives rise to field capacity.
Darcy's law and some of the characteristics of the redistribution process can be used to get a better understanding of field capacity. Note that
the water content in the wetted part of the profile in Fig. 9.3 is almost
constant with depth, implying that the matric potential is also almost
constant. To do a simple (but rough) analysis of redistribution, the matric
induced flow can be neglected. Then just the gravitational part is left.
Since neither g nor K are ever zero (except when the soil is completely
dry), there will always be some flow out of the wetted zone. We choose
a value E for the flow out of the wetted portion of the profile, such that
the flow can be considered negligible when compared to water inputs or
other water losses. Using Eqs. (9.1) and (9.2),
where n = 2 + 3lb and is the field capacity water potential corresponding to a drainage rate of E in units of kgm%-'. Substituting the