

Water Flow in Soil
for a saturated soil is gK,. The saturated conductivity for the soil in
Fig. 9.1 was set at 0.001 kg s md3, so the final infiltration rate should
be 0.0098 kg m-2 s-' (0.0098 mm s-I). It can be seen that both curves
are approaching this value. The final infiltration rate for the horizontal
column is zero.
The important result of the foregoing analysis is that the final infiltration rate can be predicted if the saturated conductivity of soil is known.
A simple analysis by Green and Ampt (191 1) can be used to estimate
the matric-dominated infiltration rate. If we were to measure the water
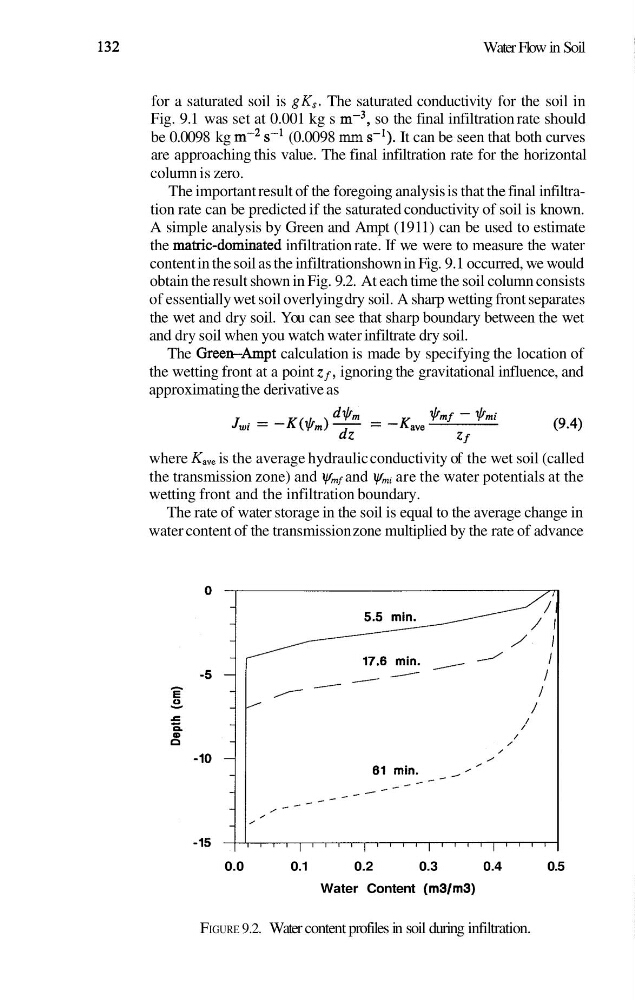
content in the soil as the infiltration shown in Fig. 9.1 occurred, we would
obtain the result shown in Fig. 9.2. At each time the soil column consists
of essentially wet soil overlying dry soil. A sharp wetting front separates
the wet and dry soil. You can see that sharp boundary between the wet
and dry soil when you watch water infiltrate dry soil.
The Green-Ampt calculation is made by specifying the location of
the wetting front at a point z f , ignoring the gravitational influence, and
approximating the derivative as
where K,,, is the average hydraulic conductivity of the wet soil (called
the transmission zone) and ymf and ymi are the water potentials at the
wetting front and the infiltration boundary.
The rate of water storage in the soil is equal to the average change in
water content of the transmission zone multiplied by the rate of advance
0.0
0.1
0.2
0.3
0.4
0.5
Water Content (m3Irn3)
FIGURE 9.2. Water content profiles in soil during infiltration.
for a saturated soil is gK,. The saturated conductivity for the soil in
Fig. 9.1 was set at 0.001 kg s md3, so the final infiltration rate should
be 0.0098 kg m-2 s-' (0.0098 mm s-I). It can be seen that both curves
are approaching this value. The final infiltration rate for the horizontal
column is zero.
The important result of the foregoing analysis is that the final infiltration rate can be predicted if the saturated conductivity of soil is known.
A simple analysis by Green and Ampt (191 1) can be used to estimate
the matric-dominated infiltration rate. If we were to measure the water
content in the soil as the infiltration shown in Fig. 9.1 occurred, we would
obtain the result shown in Fig. 9.2. At each time the soil column consists
of essentially wet soil overlying dry soil. A sharp wetting front separates
the wet and dry soil. You can see that sharp boundary between the wet
and dry soil when you watch water infiltrate dry soil.
The Green-Ampt calculation is made by specifying the location of
the wetting front at a point z f , ignoring the gravitational influence, and
approximating the derivative as
where K,,, is the average hydraulic conductivity of the wet soil (called
the transmission zone) and ymf and ymi are the water potentials at the
wetting front and the infiltration boundary.
The rate of water storage in the soil is equal to the average change in
water content of the transmission zone multiplied by the rate of advance
0.0
0.1
0.2
0.3
0.4
0.5
Water Content (m3Irn3)
FIGURE 9.2. Water content profiles in soil during infiltration.