

222
c
C
0.20
0.16
0.12
0.08
0.04
o
7. Mathematical Models of Groundwater Quality
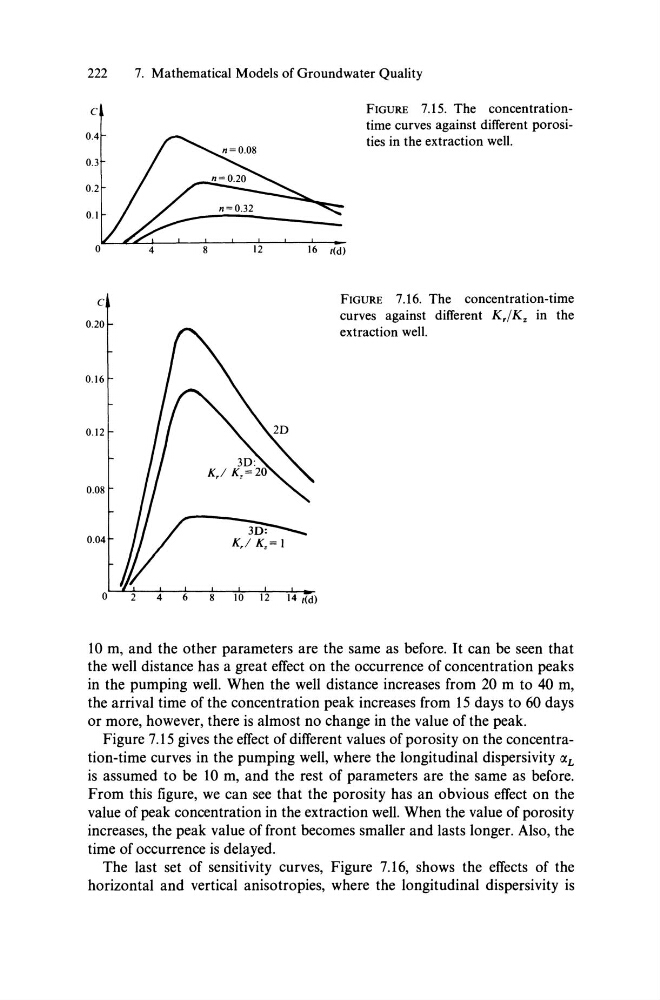
FrGURE 7.15. The concentrationtime curves against different porosities in the extraction weil.
FrGURE 7.16. The concentration-time
curves against different K,/Kz in the
extraction weil.
10 m, and the other parameters are the same as before. It can be seen that
the weIl distance has a great effect on the occurrence of concentration peaks
in the pumping weIl. When the weIl distance increases from 20 m to 40 m,
the arrival time of the concentration peak increases from 15 days to 60 days
or more, however, there is almost no change in the value of the peak.
Figure 7.15 gives the effect of different values ofporosity on the concentration-time curves in the pumping weIl, where the longitudinal dispersivity (XL
is assumed to be 10 m, and the rest of parameters are the same as before.
From this figure, we can see that the porosity has an obvious effect on the
value of peak concentration in the extraction weIl. When the value of porosity
increases, the peak value of front becomes smaller and lasts longer. Also, the
time of occurrence is delayed.
The last set of sensitivity curves, Figure 7.16, shows the effects of the
horizontal and vertical anisotropies, where the longitudinal dispersivity is
c
C
0.20
0.16
0.12
0.08
0.04
o
7. Mathematical Models of Groundwater Quality
FrGURE 7.15. The concentrationtime curves against different porosities in the extraction weil.
FrGURE 7.16. The concentration-time
curves against different K,/Kz in the
extraction weil.
10 m, and the other parameters are the same as before. It can be seen that
the weIl distance has a great effect on the occurrence of concentration peaks
in the pumping weIl. When the weIl distance increases from 20 m to 40 m,
the arrival time of the concentration peak increases from 15 days to 60 days
or more, however, there is almost no change in the value of the peak.
Figure 7.15 gives the effect of different values ofporosity on the concentration-time curves in the pumping weIl, where the longitudinal dispersivity (XL
is assumed to be 10 m, and the rest of parameters are the same as before.
From this figure, we can see that the porosity has an obvious effect on the
value of peak concentration in the extraction weIl. When the value of porosity
increases, the peak value of front becomes smaller and lasts longer. Also, the
time of occurrence is delayed.
The last set of sensitivity curves, Figure 7.16, shows the effects of the
horizontal and vertical anisotropies, where the longitudinal dispersivity is