

7 Structural Analysis of Oil-Spill Booms
161
The stress are concentrated on the skirt at its bottom chain and its upper leach.
We notice that the third boom section CD on the upper right of the Fig. 7.13 takes
the form of a buckling structure. It is a consequence of a reduced radius of curvature
R(s) of that section under a normal pneumatic pressure of the float.
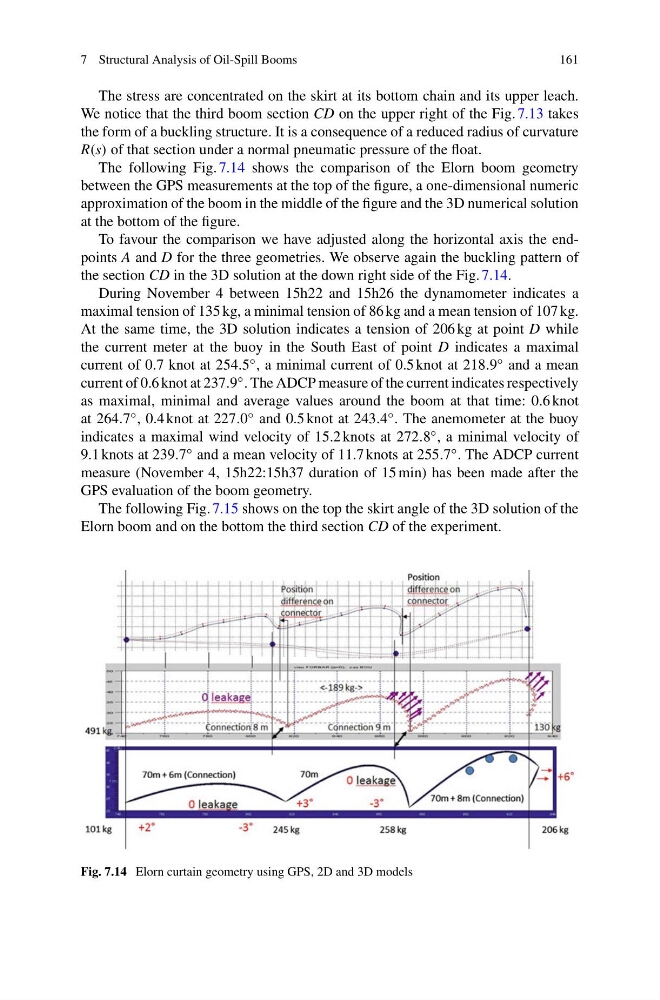
The following Fig. 7.14 shows the comparison of the Elorn boom geometry
between the GPS measurements at the top of the figure, a one-dimensional numeric
approximation of the boom in the middle of the figure and the 3D numerical solution
at the bottom of the figure.
To favour the comparison we have adjusted along the horizontal axis the endpoints A and D for the three geometries. We observe again the buckling pattern of
the section CD in the 3D solution at the down right side of the Fig. 7.14.
During November 4 between 15h22 and 15h26 the dynamometer indicates a
maximal tension of 135 kg, a minimal tension of 86 kg and a mean tension of 107 kg.
At the same time, the 3D solution indicates a tension of 206 kg at point D while
the current meter at the buoy in the South East of point D indicates a maximal
current of 0.7 knot at 254.5 ◦ , a minimal current of 0.5 knot at 218.9 ◦ and a mean
current of 0.6 knot at 237.9 ◦ . The ADCP measure of the current indicates respectively
as maximal, minimal and average values around the boom at that time: 0.6 knot
at 264.7 ◦ , 0.4 knot at 227.0 ◦ and 0.5 knot at 243.4 ◦ . The anemometer at the buoy
indicates a maximal wind velocity of 15.2 knots at 272.8 ◦ , a minimal velocity of
9.1 knots at 239.7 ◦ and a mean velocity of 11.7 knots at 255.7 ◦ . The ADCP current
measure (November 4, 15h22:15h37 duration of 15 min) has been made after the
GPS evaluation of the boom geometry.
The following Fig. 7.15 shows on the top the skirt angle of the 3D solution of the
Elorn boom and on the bottom the third section CD of the experiment.
Fig. 7.14 Elorn curtain geometry using GPS, 2D and 3D models
161
The stress are concentrated on the skirt at its bottom chain and its upper leach.
We notice that the third boom section CD on the upper right of the Fig. 7.13 takes
the form of a buckling structure. It is a consequence of a reduced radius of curvature
R(s) of that section under a normal pneumatic pressure of the float.
The following Fig. 7.14 shows the comparison of the Elorn boom geometry
between the GPS measurements at the top of the figure, a one-dimensional numeric
approximation of the boom in the middle of the figure and the 3D numerical solution
at the bottom of the figure.
To favour the comparison we have adjusted along the horizontal axis the endpoints A and D for the three geometries. We observe again the buckling pattern of
the section CD in the 3D solution at the down right side of the Fig. 7.14.
During November 4 between 15h22 and 15h26 the dynamometer indicates a
maximal tension of 135 kg, a minimal tension of 86 kg and a mean tension of 107 kg.
At the same time, the 3D solution indicates a tension of 206 kg at point D while
the current meter at the buoy in the South East of point D indicates a maximal
current of 0.7 knot at 254.5 ◦ , a minimal current of 0.5 knot at 218.9 ◦ and a mean
current of 0.6 knot at 237.9 ◦ . The ADCP measure of the current indicates respectively
as maximal, minimal and average values around the boom at that time: 0.6 knot
at 264.7 ◦ , 0.4 knot at 227.0 ◦ and 0.5 knot at 243.4 ◦ . The anemometer at the buoy
indicates a maximal wind velocity of 15.2 knots at 272.8 ◦ , a minimal velocity of
9.1 knots at 239.7 ◦ and a mean velocity of 11.7 knots at 255.7 ◦ . The ADCP current
measure (November 4, 15h22:15h37 duration of 15 min) has been made after the
GPS evaluation of the boom geometry.
The following Fig. 7.15 shows on the top the skirt angle of the 3D solution of the
Elorn boom and on the bottom the third section CD of the experiment.
Fig. 7.14 Elorn curtain geometry using GPS, 2D and 3D models