

6 – Seabed Environments, Habitats and Biological Assemblages
53
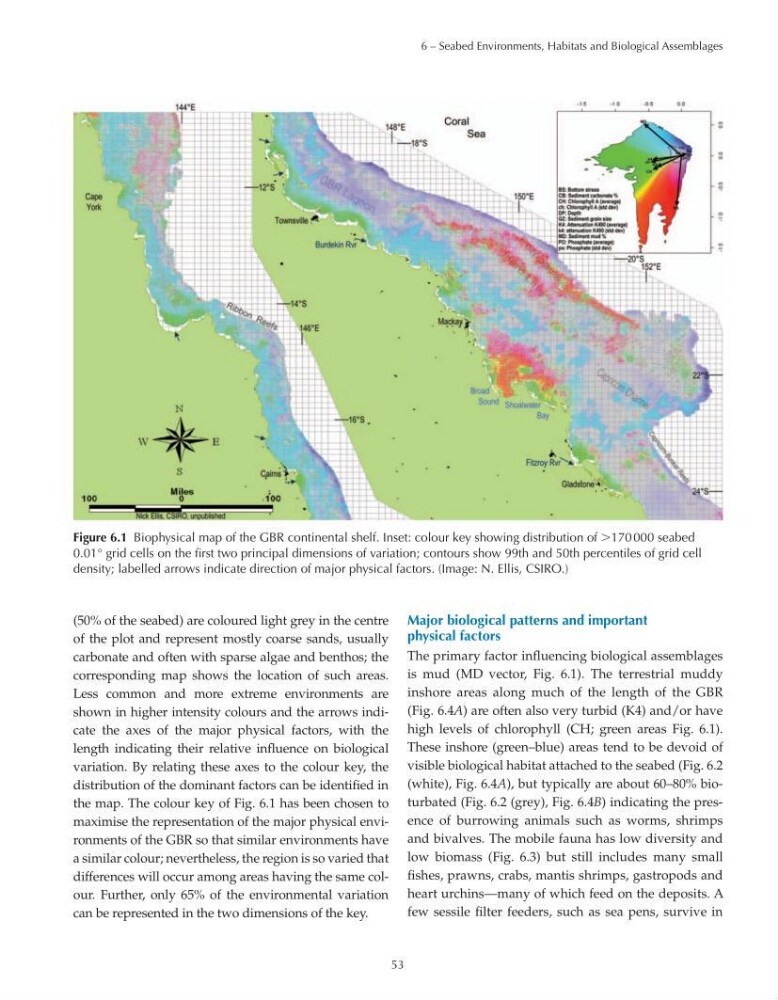
Figure 6.1 Biophysical map of the GBR continental shelf. Inset: colour key showing distribution of 170 000 seabed
0.01° grid cells on the first two principal dimensions of variation; contours show 99th and 50th percentiles of grid cell
density; labelled arrows indicate direction of major physical factors. (Image: N. Ellis, CSIRO.)
(50% of the seabed) are coloured light grey in the centre
of the plot and represent mostly coarse sands, usually
carbonate and often with sparse algae and benthos; the
corresponding map shows the location of such areas.
Less common and more extreme environments are
shown in higher intensity colours and the arrows indicate the axes of the major physical factors, with the
length indicating their relative influence on biological
variation. By relating these axes to the colour key, the
distribution of the dominant factors can be identified in
the map. The colour key of Fig. 6.1 has been chosen to
maximise the representation of the major physical environments of the GBR so that similar environments have
a similar colour; nevertheless, the region is so varied that
differences will occur among areas having the same colour. Further, only 65% of the environmental variation
can be represented in the two dimensions of the key.
Major biological patterns and important
physical factors
The primary factor influencing biological assemblages
is mud (MD vector, Fig. 6.1). The terrestrial muddy
inshore areas along much of the length of the GBR
(Fig. 6.4A) are often also very turbid (K4) and/or have
high levels of chlorophyll (CH; green areas Fig. 6.1).
These inshore (green–blue) areas tend to be devoid of
visible biological habitat attached to the seabed (Fig. 6.2
(white), Fig. 6.4A), but typically are about 60–80% bioturbated (Fig. 6.2 (grey), Fig. 6.4B) indicating the presence of burrowing animals such as worms, shrimps
and bivalves. The mobile fauna has low diversity and
low biomass (Fig. 6.3) but still includes many small
fishes, prawns, crabs, mantis shrimps, gastropods and
heart urchins—many of which feed on the deposits. A
few sessile filter feeders, such as sea pens, survive in
53
Figure 6.1 Biophysical map of the GBR continental shelf. Inset: colour key showing distribution of 170 000 seabed
0.01° grid cells on the first two principal dimensions of variation; contours show 99th and 50th percentiles of grid cell
density; labelled arrows indicate direction of major physical factors. (Image: N. Ellis, CSIRO.)
(50% of the seabed) are coloured light grey in the centre
of the plot and represent mostly coarse sands, usually
carbonate and often with sparse algae and benthos; the
corresponding map shows the location of such areas.
Less common and more extreme environments are
shown in higher intensity colours and the arrows indicate the axes of the major physical factors, with the
length indicating their relative influence on biological
variation. By relating these axes to the colour key, the
distribution of the dominant factors can be identified in
the map. The colour key of Fig. 6.1 has been chosen to
maximise the representation of the major physical environments of the GBR so that similar environments have
a similar colour; nevertheless, the region is so varied that
differences will occur among areas having the same colour. Further, only 65% of the environmental variation
can be represented in the two dimensions of the key.
Major biological patterns and important
physical factors
The primary factor influencing biological assemblages
is mud (MD vector, Fig. 6.1). The terrestrial muddy
inshore areas along much of the length of the GBR
(Fig. 6.4A) are often also very turbid (K4) and/or have
high levels of chlorophyll (CH; green areas Fig. 6.1).
These inshore (green–blue) areas tend to be devoid of
visible biological habitat attached to the seabed (Fig. 6.2
(white), Fig. 6.4A), but typically are about 60–80% bioturbated (Fig. 6.2 (grey), Fig. 6.4B) indicating the presence of burrowing animals such as worms, shrimps
and bivalves. The mobile fauna has low diversity and
low biomass (Fig. 6.3) but still includes many small
fishes, prawns, crabs, mantis shrimps, gastropods and
heart urchins—many of which feed on the deposits. A
few sessile filter feeders, such as sea pens, survive in