

The Great Barrier Reef
124
BOX 13.2 HOW DO WE MEASURE BIODIVERSITY AND ANALYSE
THE DATA?
Species richness is generally measured as number of species per unit area. Richness will,
of course, increase with area and decisions have to be made on sample unit sizes that
give estimates of diversity with a level of accuracy that suits the question being asked;
particularly large areas are required for rare taxa. Species richness does not consider the
proportion of each species in the assemblage, or the ‘evenness’ of representation. Measures of evenness are an attempt to measure dominance of a few species in a sample unit.
Where one or a few species are very abundant when compared to the total number of
species in the sample, then evenness is low.
Heterogeneity of an assemblage is a combination of species richness and the evenness
of species representation. Heterogeneity indices (including, logarithmic series and log
normal distributions as well as nonparametric measures such as Simpson’s index, the
Shannon-Wiener function and the Brillouin Index) have often been used to measure diversity. Krebs recommends the following when measuring biodiversity: (1) construct
Whittaker plots of log abundance v. species rank; (2) where sampling effort varies spatially use the ‘rarefaction method’ for estimating the number of species expected in a
random sample of individuals taken from a collection (this will give valid comparisons of
richness among assemblages); (3) explore the use of log series and lognormal curves
where variation in patterns are shown in the Whittaker plots; (4) use an inverse Simpson’s
Index of the exponential form of the Shannon-Wiener function to describe heterogeneity.
Depending on your hypothesis you may want to weight common species (Simpson’s) or
rare species more (Shannon’s) in the analysis. The latter decision is also critical in complex analyses of assemblage composition such as Multi Dimensional Scaling (MDS)
( described by Clark and Warwick) and complementary tests such as analyses of similarity and dissimilarity among samples. Some studies use ‘indicator species’ as a measure of
change in an assemblage, but the robust use of indicators needs to be tested carefully.
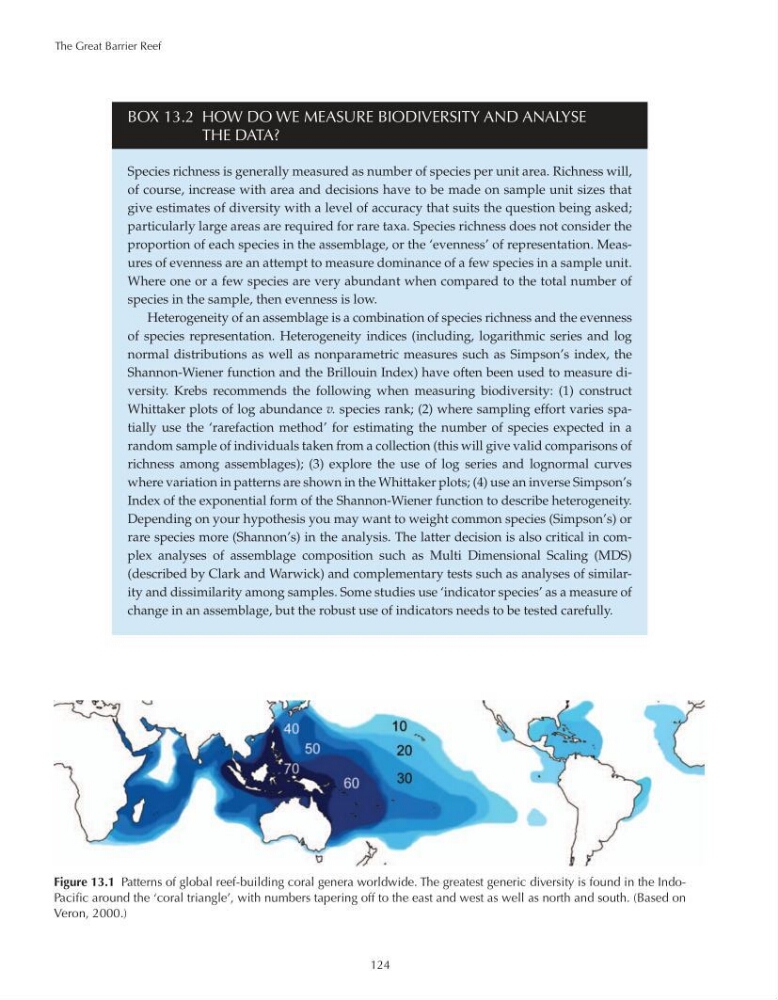
Figure 13.1 Patterns of global reef-building coral genera worldwide. The greatest generic diversity is found in the IndoPacific around the ‘coral triangle’, with numbers tapering off to the east and west as well as north and south. (Based on
Veron, 2000.)
124
BOX 13.2 HOW DO WE MEASURE BIODIVERSITY AND ANALYSE
THE DATA?
Species richness is generally measured as number of species per unit area. Richness will,
of course, increase with area and decisions have to be made on sample unit sizes that
give estimates of diversity with a level of accuracy that suits the question being asked;
particularly large areas are required for rare taxa. Species richness does not consider the
proportion of each species in the assemblage, or the ‘evenness’ of representation. Measures of evenness are an attempt to measure dominance of a few species in a sample unit.
Where one or a few species are very abundant when compared to the total number of
species in the sample, then evenness is low.
Heterogeneity of an assemblage is a combination of species richness and the evenness
of species representation. Heterogeneity indices (including, logarithmic series and log
normal distributions as well as nonparametric measures such as Simpson’s index, the
Shannon-Wiener function and the Brillouin Index) have often been used to measure diversity. Krebs recommends the following when measuring biodiversity: (1) construct
Whittaker plots of log abundance v. species rank; (2) where sampling effort varies spatially use the ‘rarefaction method’ for estimating the number of species expected in a
random sample of individuals taken from a collection (this will give valid comparisons of
richness among assemblages); (3) explore the use of log series and lognormal curves
where variation in patterns are shown in the Whittaker plots; (4) use an inverse Simpson’s
Index of the exponential form of the Shannon-Wiener function to describe heterogeneity.
Depending on your hypothesis you may want to weight common species (Simpson’s) or
rare species more (Shannon’s) in the analysis. The latter decision is also critical in complex analyses of assemblage composition such as Multi Dimensional Scaling (MDS)
( described by Clark and Warwick) and complementary tests such as analyses of similarity and dissimilarity among samples. Some studies use ‘indicator species’ as a measure of
change in an assemblage, but the robust use of indicators needs to be tested carefully.
Figure 13.1 Patterns of global reef-building coral genera worldwide. The greatest generic diversity is found in the IndoPacific around the ‘coral triangle’, with numbers tapering off to the east and west as well as north and south. (Based on
Veron, 2000.)