

8.4.3 EFFECTS ON PLANTS
Studies on the effects of O 3 on higher plants are extensive. Effects highlighted
by the experimental results include:
either an increase or a decrease in plant growth
32
decrease in size, weight, and number of fruits
33
decrease in shoot and root growth
34,35
decrease in seed oil
35
decrease in growth ring size
36
decrease in net photosynthesis
37
decrease in unsaturated fatty acids
38
increase in membrane permeability
39
increase in respiration
40
altered intermediary metabolism
The effect of O 3 on plant metabolism is complex. However, it is well
established that photochemical oxidants such as O 3 and PAN can oxidize –SH
groups, and such oxidation may adversely affect enzyme activity. Examples
include O 3 -induced inhibition of several enzymes involved in carbohydrate
metabolism, such as phosphoglucomutase and glyceraldehyde-3-phosphate
dehydrogenase. The hydrolysis of reserve starch in cucumber, bean, and
monkey flower was inhibited by exposure to 0.05 ppm O 3 for 2 to 6 hours,
40
suggesting an inhibitory effect on amylase or phosphorylase. While decrease in
glyceraldehyde-3-phosphate dehydrogenase activity suggests inhibition of
glycolysis, an increase in the activity of glucose-6-phosphate dehydrogenase
and 6-phosphogluconate dehydrogenase reported by some workers implies
elevated activity of the pentose phosphate pathway.
41 Recent studies indicate
that exposure of mung bean seedlings to 0.25 ppm of O 3 for 2 hours markedly
inhibited invertase activity.
42
Exposure to O 3 also interferes with lipid metabolism. For instance, lipid
synthesis, requiring NADPH and ATP, is known to proceed at a lower rate,
presumably because O 3 lowers the total energy of the cell. O 3 also causes
Air Pollution – Inorganic Gases
123
[16:53 26/8/04 P:/CRC PRESS/4365 MING-HO.751 (1670)/4365-008.3d]
Ref: 4365 MING-HO YU Chap-008 Page: 123 111-134
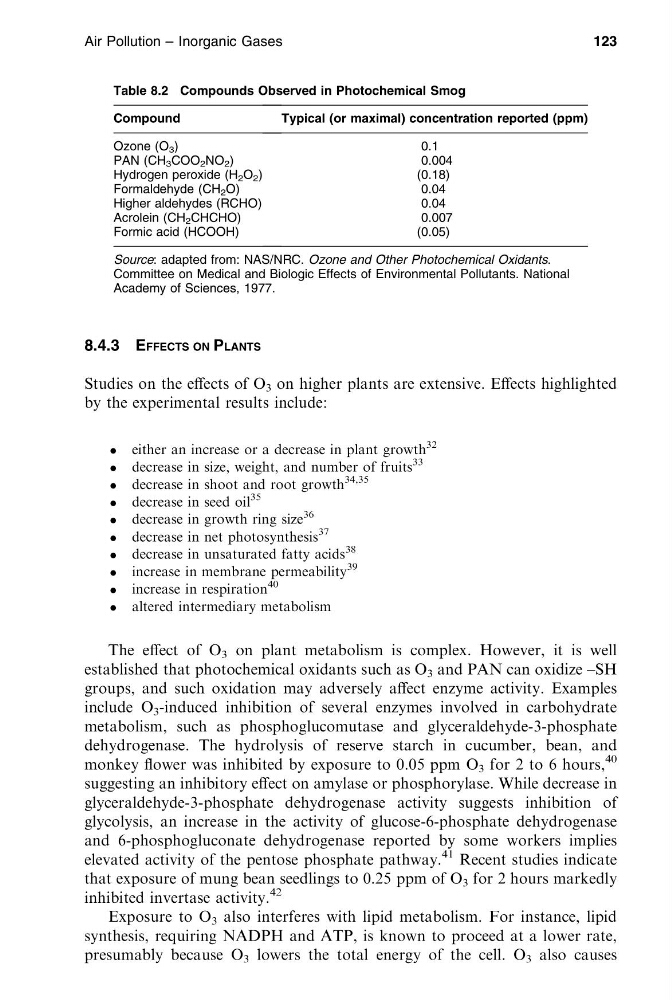
Table 8.2 Compounds Observed in Photochemical Smog
Compound
Typical (or maximal) concentration reported (ppm)
Ozone (O 3 )
0.1
PAN (CH 3 COO 2 NO 2 )
0.004
Hydrogen peroxide (H 2 O 2 )
(0.18)
Formaldehyde (CH 2 O)
0.04
Higher aldehydes (RCHO)
0.04
Acrolein (CH 2 CHCHO)
0.007
Formic acid (HCOOH)
(0.05)
Source: adapted from: NAS/NRC. Ozone and Other Photochemical Oxidants.
Committee on Medical and Biologic Effects of Environmental Pollutants. National
Academy of Sciences, 1977.
Studies on the effects of O 3 on higher plants are extensive. Effects highlighted
by the experimental results include:
either an increase or a decrease in plant growth
32
decrease in size, weight, and number of fruits
33
decrease in shoot and root growth
34,35
decrease in seed oil
35
decrease in growth ring size
36
decrease in net photosynthesis
37
decrease in unsaturated fatty acids
38
increase in membrane permeability
39
increase in respiration
40
altered intermediary metabolism
The effect of O 3 on plant metabolism is complex. However, it is well
established that photochemical oxidants such as O 3 and PAN can oxidize –SH
groups, and such oxidation may adversely affect enzyme activity. Examples
include O 3 -induced inhibition of several enzymes involved in carbohydrate
metabolism, such as phosphoglucomutase and glyceraldehyde-3-phosphate
dehydrogenase. The hydrolysis of reserve starch in cucumber, bean, and
monkey flower was inhibited by exposure to 0.05 ppm O 3 for 2 to 6 hours,
40
suggesting an inhibitory effect on amylase or phosphorylase. While decrease in
glyceraldehyde-3-phosphate dehydrogenase activity suggests inhibition of
glycolysis, an increase in the activity of glucose-6-phosphate dehydrogenase
and 6-phosphogluconate dehydrogenase reported by some workers implies
elevated activity of the pentose phosphate pathway.
41 Recent studies indicate
that exposure of mung bean seedlings to 0.25 ppm of O 3 for 2 hours markedly
inhibited invertase activity.
42
Exposure to O 3 also interferes with lipid metabolism. For instance, lipid
synthesis, requiring NADPH and ATP, is known to proceed at a lower rate,
presumably because O 3 lowers the total energy of the cell. O 3 also causes
Air Pollution – Inorganic Gases
123
[16:53 26/8/04 P:/CRC PRESS/4365 MING-HO.751 (1670)/4365-008.3d]
Ref: 4365 MING-HO YU Chap-008 Page: 123 111-134
Table 8.2 Compounds Observed in Photochemical Smog
Compound
Typical (or maximal) concentration reported (ppm)
Ozone (O 3 )
0.1
PAN (CH 3 COO 2 NO 2 )
0.004
Hydrogen peroxide (H 2 O 2 )
(0.18)
Formaldehyde (CH 2 O)
0.04
Higher aldehydes (RCHO)
0.04
Acrolein (CH 2 CHCHO)
0.007
Formic acid (HCOOH)
(0.05)
Source: adapted from: NAS/NRC. Ozone and Other Photochemical Oxidants.
Committee on Medical and Biologic Effects of Environmental Pollutants. National
Academy of Sciences, 1977.