

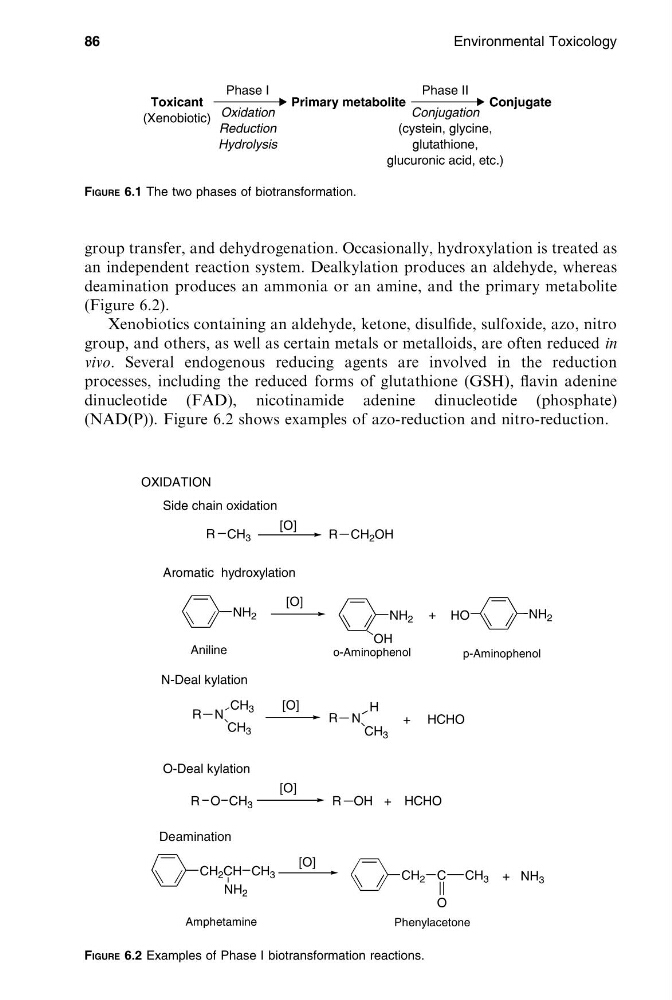
group transfer, and dehydrogenation. Occasionally, hydroxylation is treated as
an independent reaction system. Dealkylation produces an aldehyde, whereas
deamination produces an ammonia or an amine, and the primary metabolite
(Figure 6.2).
Xenobiotics containing an aldehyde, ketone, disulfide, sulfoxide, azo, nitro
group, and others, as well as certain metals or metalloids, are often reduced in
vivo. Several endogenous reducing agents are involved in the reduction
processes, including the reduced forms of glutathione (GSH), flavin adenine
dinucleotide (FAD), nicotinamide adenine dinucleotide (phosphate)
(NAD(P)). Figure 6.2 shows examples of azo-reduction and nitro-reduction.
86
Environmental Toxicology
[16:54 26/8/04 P:/CRC PRESS/4365 MING-HO.751 (1670)/4365-006.3d]
Ref: 4365 MING-HO YU Chap-006 Page: 86 85-98
FIGURE 6.1 The two phases of biotransformation.
FIGURE 6.2 Examples of Phase I biotransformation reactions.
an independent reaction system. Dealkylation produces an aldehyde, whereas
deamination produces an ammonia or an amine, and the primary metabolite
(Figure 6.2).
Xenobiotics containing an aldehyde, ketone, disulfide, sulfoxide, azo, nitro
group, and others, as well as certain metals or metalloids, are often reduced in
vivo. Several endogenous reducing agents are involved in the reduction
processes, including the reduced forms of glutathione (GSH), flavin adenine
dinucleotide (FAD), nicotinamide adenine dinucleotide (phosphate)
(NAD(P)). Figure 6.2 shows examples of azo-reduction and nitro-reduction.
86
Environmental Toxicology
[16:54 26/8/04 P:/CRC PRESS/4365 MING-HO.751 (1670)/4365-006.3d]
Ref: 4365 MING-HO YU Chap-006 Page: 86 85-98
FIGURE 6.1 The two phases of biotransformation.
FIGURE 6.2 Examples of Phase I biotransformation reactions.