

530
CHAPTE R 18 TE M PE RATU R E, H EAT, AN D TH E FI RST L AW OF TH E R M ODYNAM ICS
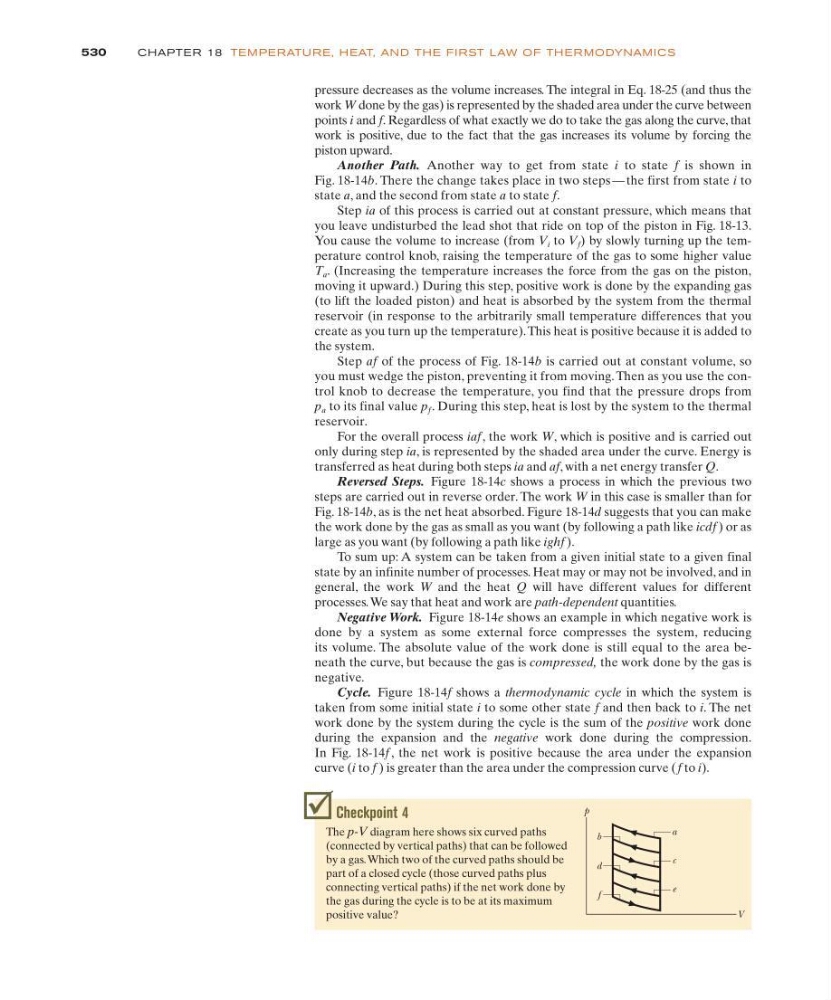
Checkpoint 4
The p-V diagram here shows six curved paths
(connected by vertical paths) that can be followed
by a gas. Which two of the curved paths should be
part of a closed cycle (those curved paths plus
connecting vertical paths) if the net work done by
the gas during the cycle is to be at its maximum
positive value?
p
V
b
d
f
a
c
e
pressure decreases as the volume increases. The integral in Eq. 18-25 (and thus the
work W done by the gas) is represented by the shaded area under the curve between
points i and f. Regardless of what exactly we do to take the gas along the curve, that
work is positive, due to the fact that the gas increases its volume by forcing the
piston upward.
Another Path. Another way to get from state i to state f is shown in
Fig. 18-14b. There the change takes place in two steps — the first from state i to
state a, and the second from state a to state f.
Step ia of this process is carried out at constant pressure, which means that
you leave undisturbed the lead shot that ride on top of the piston in Fig. 18-13.
You cause the volume to increase (from V i to V f ) by slowly turning up the temperature control knob, raising the temperature of the gas to some higher value
T a . (Increasing the temperature increases the force from the gas on the piston,
moving it upward.) During this step, positive work is done by the expanding gas
(to lift the loaded piston) and heat is absorbed by the system from the thermal
reservoir (in response to the arbitrarily small temperature differences that you
create as you turn up the temperature). This heat is positive because it is added to
the system.
Step af of the process of Fig. 18-14b is carried out at constant volume, so
you must wedge the piston, preventing it from moving. Then as you use the control knob to decrease the temperature, you find that the pressure drops from
p a to its final value p f . During this step, heat is lost by the system to the thermal
reservoir.
For the overall process iaf, the work W, which is positive and is carried out
only during step ia, is represented by the shaded area under the curve. Energy is
transferred as heat during both steps ia and af, with a net energy transfer Q.
Reversed Steps. Figure 18-14c shows a process in which the previous two
steps are carried out in reverse order. The work W in this case is smaller than for
Fig. 18-14b, as is the net heat absorbed. Figure 18-14d suggests that you can make
the work done by the gas as small as you want (by following a path like icdf ) or as
large as you want (by following a path like ighf ).
To sum up: A system can be taken from a given initial state to a given final
state by an infinite number of processes. Heat may or may not be involved, and in
general, the work W and the heat Q will have different values for different
processes. We say that heat and work are path-dependent quantities.
Negative Work. Figure 18-14e shows an example in which negative work is
done by a system as some external force compresses the system, reducing
its volume. The absolute value of the work done is still equal to the area beneath the curve, but because the gas is compressed, the work done by the gas is
negative.
Cycle. Figure 18-14f shows a thermodynamic cycle in which the system is
taken from some initial state i to some other state f and then back to i. The net
work done by the system during the cycle is the sum of the positive work done
during the expansion and the negative work done during the compression.
In Fig. 18-14f , the net work is positive because the area under the expansion
curve (i to f ) is greater than the area under the compression curve (f to i).
CHAPTE R 18 TE M PE RATU R E, H EAT, AN D TH E FI RST L AW OF TH E R M ODYNAM ICS
Checkpoint 4
The p-V diagram here shows six curved paths
(connected by vertical paths) that can be followed
by a gas. Which two of the curved paths should be
part of a closed cycle (those curved paths plus
connecting vertical paths) if the net work done by
the gas during the cycle is to be at its maximum
positive value?
p
V
b
d
f
a
c
e
pressure decreases as the volume increases. The integral in Eq. 18-25 (and thus the
work W done by the gas) is represented by the shaded area under the curve between
points i and f. Regardless of what exactly we do to take the gas along the curve, that
work is positive, due to the fact that the gas increases its volume by forcing the
piston upward.
Another Path. Another way to get from state i to state f is shown in
Fig. 18-14b. There the change takes place in two steps — the first from state i to
state a, and the second from state a to state f.
Step ia of this process is carried out at constant pressure, which means that
you leave undisturbed the lead shot that ride on top of the piston in Fig. 18-13.
You cause the volume to increase (from V i to V f ) by slowly turning up the temperature control knob, raising the temperature of the gas to some higher value
T a . (Increasing the temperature increases the force from the gas on the piston,
moving it upward.) During this step, positive work is done by the expanding gas
(to lift the loaded piston) and heat is absorbed by the system from the thermal
reservoir (in response to the arbitrarily small temperature differences that you
create as you turn up the temperature). This heat is positive because it is added to
the system.
Step af of the process of Fig. 18-14b is carried out at constant volume, so
you must wedge the piston, preventing it from moving. Then as you use the control knob to decrease the temperature, you find that the pressure drops from
p a to its final value p f . During this step, heat is lost by the system to the thermal
reservoir.
For the overall process iaf, the work W, which is positive and is carried out
only during step ia, is represented by the shaded area under the curve. Energy is
transferred as heat during both steps ia and af, with a net energy transfer Q.
Reversed Steps. Figure 18-14c shows a process in which the previous two
steps are carried out in reverse order. The work W in this case is smaller than for
Fig. 18-14b, as is the net heat absorbed. Figure 18-14d suggests that you can make
the work done by the gas as small as you want (by following a path like icdf ) or as
large as you want (by following a path like ighf ).
To sum up: A system can be taken from a given initial state to a given final
state by an infinite number of processes. Heat may or may not be involved, and in
general, the work W and the heat Q will have different values for different
processes. We say that heat and work are path-dependent quantities.
Negative Work. Figure 18-14e shows an example in which negative work is
done by a system as some external force compresses the system, reducing
its volume. The absolute value of the work done is still equal to the area beneath the curve, but because the gas is compressed, the work done by the gas is
negative.
Cycle. Figure 18-14f shows a thermodynamic cycle in which the system is
taken from some initial state i to some other state f and then back to i. The net
work done by the system during the cycle is the sum of the positive work done
during the expansion and the negative work done during the compression.
In Fig. 18-14f , the net work is positive because the area under the expansion
curve (i to f ) is greater than the area under the compression curve (f to i).