

529
18-5 TH E FI RST L AW OF TH E R M ODYNAM ICS
Lead shot
W
Insulation
Thermal reservoir
T
Control knob
Q
The gas does work
on this piston.
We control the heat transfer
by adjusting the temperature.
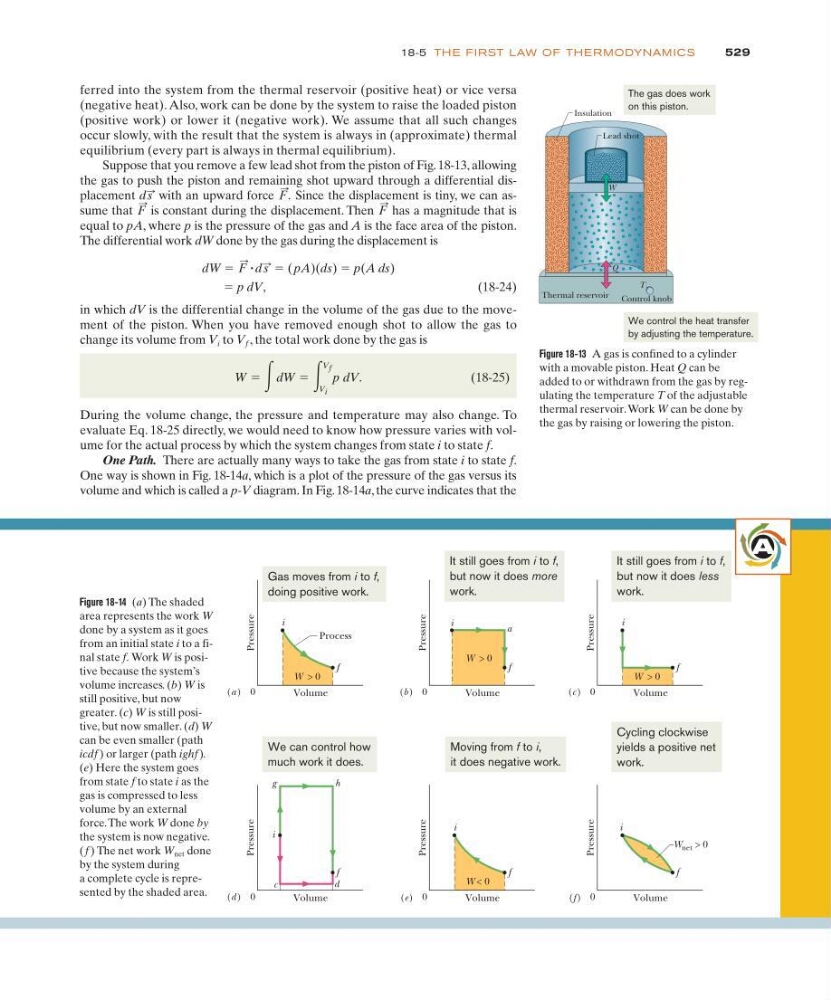
Figure 18-13 A gas is confined to a cylinder
with a movable piston. Heat Q can be
added to or withdrawn from the gas by regulating the temperature T of the adjustable
thermal reservoir. Work W can be done by
the gas by raising or lowering the piston.
ferred into the system from the thermal reservoir (positive heat) or vice versa
(negative heat). Also, work can be done by the system to raise the loaded piston
(positive work) or lower it (negative work). We assume that all such changes
occur slowly, with the result that the system is always in (approximate) thermal
equilibrium (every part is always in thermal equilibrium).
Suppose that you remove a few lead shot from the piston of Fig. 18-13, allowing
the gas to push the piston and remaining shot upward through a differential displacement d with an upward force . Since the displacement is tiny, we can assume that is constant during the displacement. Then has a magnitude that is
equal to pA, where p is the pressure of the gas and A is the face area of the piston.
The differential work dW done by the gas during the displacement is
dW ϭ ؒd ϭ (pA)(ds) ϭ p(A ds)
ϭ p dV,
( 1 8 - 2 4 )
in which dV is the differential change in the volume of the gas due to the movement of the piston. When you have removed enough shot to allow the gas to
change its volume from V i to V f , the total work done by the gas is
(18-25)
During the volume change, the pressure and temperature may also change. To
evaluate Eq. 18-25 directly, we would need to know how pressure varies with volume for the actual process by which the system changes from state i to state f.
One Path. There are actually many ways to take the gas from state i to state f.
One way is shown in Fig. 18-14a, which is a plot of the pressure of the gas versus its
volume and which is called a p-V diagram. In Fig. 18-14a, the curve indicates that the
W ϭ ͵dW ϭ ͵
V f
V i
p dV.
s
:
F
:
F
:
F
:
F
:
s
:
Figure 18-14 (a) The shaded
area represents the work W
done by a system as it goes
from an initial state i to a final state f. Work W is positive because the system’s
volume increases. (b) W is
still positive, but now
greater. (c) W is still positive, but now smaller. (d) W
can be even smaller (path
icdf ) or larger (path ighf).
(e) Here the system goes
from state f to state i as the
gas is compressed to less
volume by an external
force. The work W done by
the system is now negative.
(f ) The net work W net done
by the system during
a complete cycle is represented by the shaded area.
Volume
Pressure
Process
f
i
W > 0
0
Volume
Pressure
f
i
W > 0
0
a
Volume
Pressure
f
i
W > 0
0
Volume
Pressure
f
i
0
g
(a )
(b )
(c )
(d )
Volume
Pressure
f
i
W < 0
0
(e )
( f )
h
d
c
Pressure
f
i
W net > 0
Volume
0
We can control how
much work it does.
Moving from f to i,
it does negative work.
Cycling clockwise
yields a positive net
work.
Gas moves from i to f,
doing positive work.
It still goes from i to f,
but now it does more
work.
It still goes from i to f,
but now it does less
work.
A
18-5 TH E FI RST L AW OF TH E R M ODYNAM ICS
Lead shot
W
Insulation
Thermal reservoir
T
Control knob
Q
The gas does work
on this piston.
We control the heat transfer
by adjusting the temperature.
Figure 18-13 A gas is confined to a cylinder
with a movable piston. Heat Q can be
added to or withdrawn from the gas by regulating the temperature T of the adjustable
thermal reservoir. Work W can be done by
the gas by raising or lowering the piston.
ferred into the system from the thermal reservoir (positive heat) or vice versa
(negative heat). Also, work can be done by the system to raise the loaded piston
(positive work) or lower it (negative work). We assume that all such changes
occur slowly, with the result that the system is always in (approximate) thermal
equilibrium (every part is always in thermal equilibrium).
Suppose that you remove a few lead shot from the piston of Fig. 18-13, allowing
the gas to push the piston and remaining shot upward through a differential displacement d with an upward force . Since the displacement is tiny, we can assume that is constant during the displacement. Then has a magnitude that is
equal to pA, where p is the pressure of the gas and A is the face area of the piston.
The differential work dW done by the gas during the displacement is
dW ϭ ؒd ϭ (pA)(ds) ϭ p(A ds)
ϭ p dV,
( 1 8 - 2 4 )
in which dV is the differential change in the volume of the gas due to the movement of the piston. When you have removed enough shot to allow the gas to
change its volume from V i to V f , the total work done by the gas is
(18-25)
During the volume change, the pressure and temperature may also change. To
evaluate Eq. 18-25 directly, we would need to know how pressure varies with volume for the actual process by which the system changes from state i to state f.
One Path. There are actually many ways to take the gas from state i to state f.
One way is shown in Fig. 18-14a, which is a plot of the pressure of the gas versus its
volume and which is called a p-V diagram. In Fig. 18-14a, the curve indicates that the
W ϭ ͵dW ϭ ͵
V f
V i
p dV.
s
:
F
:
F
:
F
:
F
:
s
:
Figure 18-14 (a) The shaded
area represents the work W
done by a system as it goes
from an initial state i to a final state f. Work W is positive because the system’s
volume increases. (b) W is
still positive, but now
greater. (c) W is still positive, but now smaller. (d) W
can be even smaller (path
icdf ) or larger (path ighf).
(e) Here the system goes
from state f to state i as the
gas is compressed to less
volume by an external
force. The work W done by
the system is now negative.
(f ) The net work W net done
by the system during
a complete cycle is represented by the shaded area.
Volume
Pressure
Process
f
i
W > 0
0
Volume
Pressure
f
i
W > 0
0
a
Volume
Pressure
f
i
W > 0
0
Volume
Pressure
f
i
0
g
(a )
(b )
(c )
(d )
Volume
Pressure
f
i
W < 0
0
(e )
( f )
h
d
c
Pressure
f
i
W net > 0
Volume
0
We can control how
much work it does.
Moving from f to i,
it does negative work.
Cycling clockwise
yields a positive net
work.
Gas moves from i to f,
doing positive work.
It still goes from i to f,
but now it does more
work.
It still goes from i to f,
but now it does less
work.
A