

262
CHAPTE R 10 ROTATION
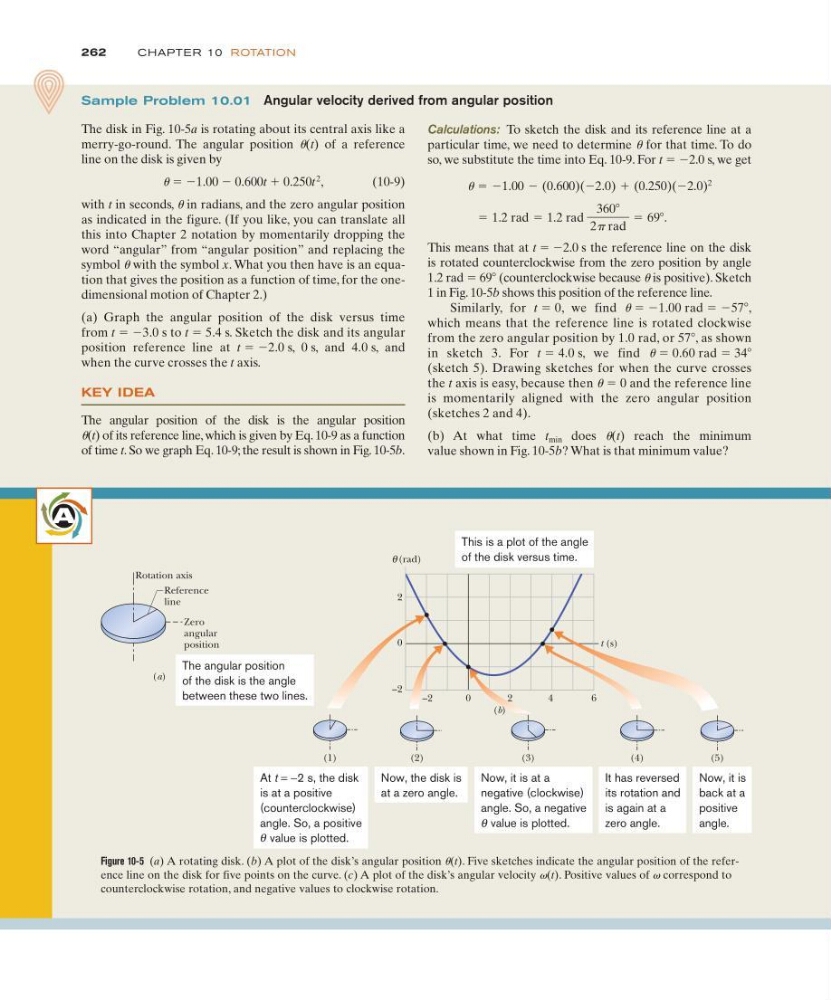
Calculations: To sketch the disk and its reference line at a
particular time, we need to determine u for that time. To do
so, we substitute the time into Eq. 10-9. For t ϭ Ϫ2.0 s, we get
This means that at t ϭ Ϫ2.0 s the reference line on the disk
is rotated counterclockwise from the zero position by angle
1.2 rad ϭ 69Њ (counterclockwise because u is positive). Sketch
1 in Fig. 10-5b shows this position of the reference line.
Similarly, for t ϭ 0, we find u ϭ Ϫ1.00 rad ϭ Ϫ57Њ,
which means that the reference line is rotated clockwise
from the zero angular position by 1.0 rad, or 57Њ, as shown
in sketch 3. For t ϭ 4.0 s, we find u ϭ 0.60 rad ϭ 34Њ
(sketch 5). Drawing sketches for when the curve crosses
the t axis is easy, because then u ϭ 0 and the reference line
is momentarily aligned with the zero angular position
(sketches 2 and 4).
(b) At what time t min does u(t) reach the minimum
value shown in Fig. 10-5b? What is that minimum value?
ϭ 1.2 rad ϭ 1.2 rad
360Њ
2 rad
ϭ 69Њ.
u ϭ Ϫ1.00 Ϫ (0.600)(Ϫ2.0) ϩ (0.250)(Ϫ2.0)
2
Sample Problem 10.01 Angular velocity derived from angular position
The disk in Fig. 10-5a is rotating about its central axis like a
merry-go-round. The angular position u(t) of a reference
line on the disk is given by
u ϭ Ϫ1.00 Ϫ 0.600t ϩ 0.250t
2
,
( 1 0 - 9 )
with t in seconds, u in radians, and the zero angular position
as indicated in the figure. (If you like, you can translate all
this into Chapter 2 notation by momentarily dropping the
word “angular” from “angular position” and replacing the
symbol u with the symbol x. What you then have is an equation that gives the position as a function of time, for the onedimensional motion of Chapter 2.)
(a) Graph the angular position of the disk versus time
from t ϭ Ϫ3.0 s to t ϭ 5.4 s. Sketch the disk and its angular
position reference line at t ϭ Ϫ2.0 s, 0 s, and 4.0 s, and
when the curve crosses the t axis.
KEY IDEA
The angular position of the disk is the angular position
u(t) of its reference line, which is given by Eq. 10-9 as a function
of time t. So we graph Eq. 10-9; the result is shown in Fig. 10-5b.
A
Zero
angular
position
Reference
line
Rotation axis
(a)
(b)
2
0
–2
0
2
4
6
(rad)
(1)
(2)
(3)
(4)
(5)
t (s)
θ
–2
The angular position
of the disk is the angle
between these two lines.
Now, the disk is
at a zero angle.
θ
At t = −2 s, the disk
is at a positive
(counterclockwise)
angle. So, a positive
value is plotted.
This is a plot of the angle
of the disk versus time.
Now, it is at a
negative (clockwise)
angle. So, a negative
value is plotted.
θ
It has reversed
its rotation and
is again at a
zero angle.
Now, it is
back at a
positive
angle.
Figure 10-5 (a) A rotating disk. (b) A plot of the disk’s angular position u(t). Five sketches indicate the angular position of the reference line on the disk for five points on the curve. (c) A plot of the disk’s angular velocity v(t). Positive values of v correspond to
counterclockwise rotation, and negative values to clockwise rotation.
CHAPTE R 10 ROTATION
Calculations: To sketch the disk and its reference line at a
particular time, we need to determine u for that time. To do
so, we substitute the time into Eq. 10-9. For t ϭ Ϫ2.0 s, we get
This means that at t ϭ Ϫ2.0 s the reference line on the disk
is rotated counterclockwise from the zero position by angle
1.2 rad ϭ 69Њ (counterclockwise because u is positive). Sketch
1 in Fig. 10-5b shows this position of the reference line.
Similarly, for t ϭ 0, we find u ϭ Ϫ1.00 rad ϭ Ϫ57Њ,
which means that the reference line is rotated clockwise
from the zero angular position by 1.0 rad, or 57Њ, as shown
in sketch 3. For t ϭ 4.0 s, we find u ϭ 0.60 rad ϭ 34Њ
(sketch 5). Drawing sketches for when the curve crosses
the t axis is easy, because then u ϭ 0 and the reference line
is momentarily aligned with the zero angular position
(sketches 2 and 4).
(b) At what time t min does u(t) reach the minimum
value shown in Fig. 10-5b? What is that minimum value?
ϭ 1.2 rad ϭ 1.2 rad
360Њ
2 rad
ϭ 69Њ.
u ϭ Ϫ1.00 Ϫ (0.600)(Ϫ2.0) ϩ (0.250)(Ϫ2.0)
2
Sample Problem 10.01 Angular velocity derived from angular position
The disk in Fig. 10-5a is rotating about its central axis like a
merry-go-round. The angular position u(t) of a reference
line on the disk is given by
u ϭ Ϫ1.00 Ϫ 0.600t ϩ 0.250t
2
,
( 1 0 - 9 )
with t in seconds, u in radians, and the zero angular position
as indicated in the figure. (If you like, you can translate all
this into Chapter 2 notation by momentarily dropping the
word “angular” from “angular position” and replacing the
symbol u with the symbol x. What you then have is an equation that gives the position as a function of time, for the onedimensional motion of Chapter 2.)
(a) Graph the angular position of the disk versus time
from t ϭ Ϫ3.0 s to t ϭ 5.4 s. Sketch the disk and its angular
position reference line at t ϭ Ϫ2.0 s, 0 s, and 4.0 s, and
when the curve crosses the t axis.
KEY IDEA
The angular position of the disk is the angular position
u(t) of its reference line, which is given by Eq. 10-9 as a function
of time t. So we graph Eq. 10-9; the result is shown in Fig. 10-5b.
A
Zero
angular
position
Reference
line
Rotation axis
(a)
(b)
2
0
–2
0
2
4
6
(rad)
(1)
(2)
(3)
(4)
(5)
t (s)
θ
–2
The angular position
of the disk is the angle
between these two lines.
Now, the disk is
at a zero angle.
θ
At t = −2 s, the disk
is at a positive
(counterclockwise)
angle. So, a positive
value is plotted.
This is a plot of the angle
of the disk versus time.
Now, it is at a
negative (clockwise)
angle. So, a negative
value is plotted.
θ
It has reversed
its rotation and
is again at a
zero angle.
Now, it is
back at a
positive
angle.
Figure 10-5 (a) A rotating disk. (b) A plot of the disk’s angular position u(t). Five sketches indicate the angular position of the reference line on the disk for five points on the curve. (c) A plot of the disk’s angular velocity v(t). Positive values of v correspond to
counterclockwise rotation, and negative values to clockwise rotation.