

Copyright © National Academy of Sciences. All rights reserved.
Solar and Space Physics: A Science for a Technological Society
284
SOLAR AND SPACE PHYSICS: A SCIENCE FOR A TECHNOLOGICAL SOCIETY
1a and 1b; motivation M1). The processes are not yet well understood, mainly because of the challenges
of measuring the solar interior and surface in crucial locations and on timescales of multiple solar cycles.
Helioseismology is revealing surprising properties of much of the solar interior. Currently, models of
the Sun that agree with helioseismology measurements are based on element abundances that disagree
with recent values obtained by spectral line analysis. The discrepancy challenges the foundations of astrophysics and must be solved in the next decade. It is widely thought that the polar regions and tachocline
play large roles in the solar cycle, and these locations are difficult to observe with helioseismology from a
single near-Earth location. A goal for the next decade is to start to probe these regions in sufficient detail to
define whether and how they affect the course of solar activity. Attaining that goal involves simultaneous
surface velocity measurements from near Earth and a vantage point separated by a sizable fraction of an
astronomical unit (stereohelioseismology).
The ESA-led Solar Orbiter will furnish brief, pioneering observations at moderate inclinations relative
to the ecliptic plane during the 2020s. The science return from this mission will be greatly enhanced if
NASA supports both additional telemetry coverage and U.S. investigations with non-U.S. instruments. White
papers offered other paths to obtain in-ecliptic stereohelioseismic observations, for example, L5 (§10.5.2.5)
and Safari. Sustained observation of the polar regions requires a high-inclination solar orbit. Such orbits
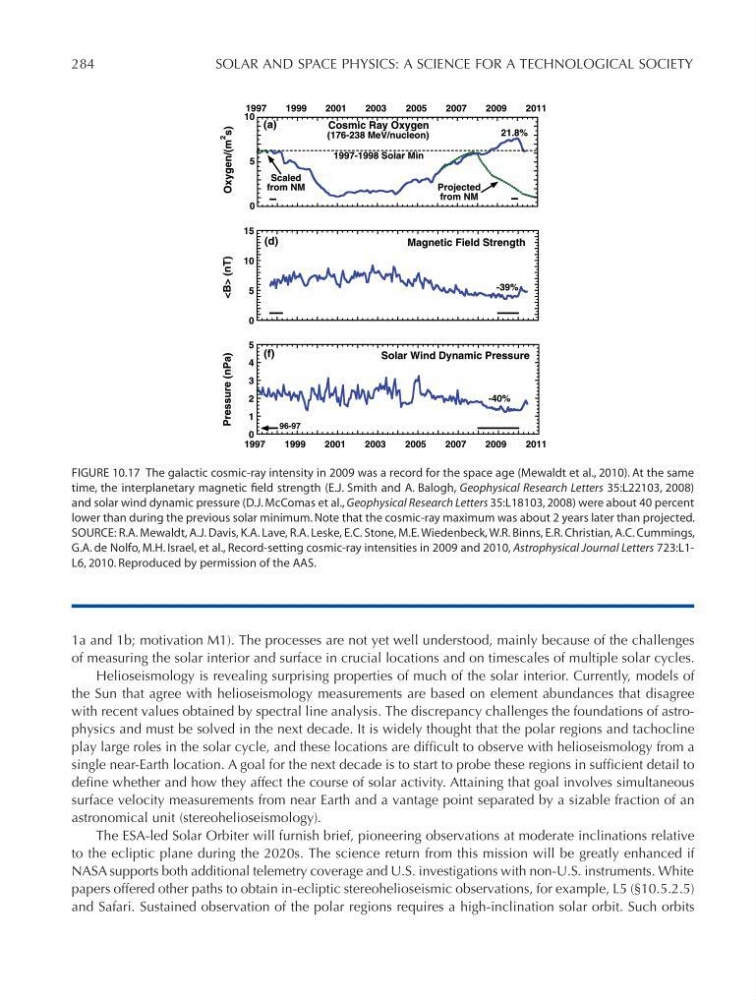
FIGURE 10.17 The galactic cosmic-ray intensity in 2009 was a record for the space age (Mewaldt et al., 2010). At the same
time, the interplanetary magnetic field strength (E.J. Smith and A. Balogh, Geophysical Research Letters 35:L22103, 2008)
and solar wind dynamic pressure (D.J. McComas et al., Geophysical Research Letters 35:L18103, 2008) were about 40 percent
lower than during the previous solar minimum. Note that the cosmic-ray maximum was about 2 years later than projected.
SOURCE: R.A. Mewaldt, A.J. Davis, K.A. Lave, R.A. Leske, E.C. Stone, M.E. Wiedenbeck, W.R. Binns, E.R. Christian, A.C. Cummings,
G.A. de Nolfo, M.H. Israel, et al., Record-setting cosmic-ray intensities in 2009 and 2010, Astrophysical Journal Letters 723:L1L6, 2010. Reproduced by permission of the AAS.
0
1
2
3
4
5
1997
1999
2001
2003
2005
2007
2009
2011
Pressure (nPa)
Solar Wind Dynamic Pressure
-40%
96-97
(f)
0
5
10
15
(nT)
Magnetic Field Strength
-39%
(d)
0
5
10
1997
1999
2001
2003
2005
2007
2009
2011
Oxygen/(m
2
s)
1997-1998 Solar Min
21.8%
Cosmic Ray Oxygen
(176-238 MeV/nucleon)
Scaled
d
e
t
c
e
j
o
r
P
M
N
m
o
r
f
from NM
(a)
Figure 10-17
Solar and Space Physics: A Science for a Technological Society
284
SOLAR AND SPACE PHYSICS: A SCIENCE FOR A TECHNOLOGICAL SOCIETY
1a and 1b; motivation M1). The processes are not yet well understood, mainly because of the challenges
of measuring the solar interior and surface in crucial locations and on timescales of multiple solar cycles.
Helioseismology is revealing surprising properties of much of the solar interior. Currently, models of
the Sun that agree with helioseismology measurements are based on element abundances that disagree
with recent values obtained by spectral line analysis. The discrepancy challenges the foundations of astrophysics and must be solved in the next decade. It is widely thought that the polar regions and tachocline
play large roles in the solar cycle, and these locations are difficult to observe with helioseismology from a
single near-Earth location. A goal for the next decade is to start to probe these regions in sufficient detail to
define whether and how they affect the course of solar activity. Attaining that goal involves simultaneous
surface velocity measurements from near Earth and a vantage point separated by a sizable fraction of an
astronomical unit (stereohelioseismology).
The ESA-led Solar Orbiter will furnish brief, pioneering observations at moderate inclinations relative
to the ecliptic plane during the 2020s. The science return from this mission will be greatly enhanced if
NASA supports both additional telemetry coverage and U.S. investigations with non-U.S. instruments. White
papers offered other paths to obtain in-ecliptic stereohelioseismic observations, for example, L5 (§10.5.2.5)
and Safari. Sustained observation of the polar regions requires a high-inclination solar orbit. Such orbits
FIGURE 10.17 The galactic cosmic-ray intensity in 2009 was a record for the space age (Mewaldt et al., 2010). At the same
time, the interplanetary magnetic field strength (E.J. Smith and A. Balogh, Geophysical Research Letters 35:L22103, 2008)
and solar wind dynamic pressure (D.J. McComas et al., Geophysical Research Letters 35:L18103, 2008) were about 40 percent
lower than during the previous solar minimum. Note that the cosmic-ray maximum was about 2 years later than projected.
SOURCE: R.A. Mewaldt, A.J. Davis, K.A. Lave, R.A. Leske, E.C. Stone, M.E. Wiedenbeck, W.R. Binns, E.R. Christian, A.C. Cummings,
G.A. de Nolfo, M.H. Israel, et al., Record-setting cosmic-ray intensities in 2009 and 2010, Astrophysical Journal Letters 723:L1L6, 2010. Reproduced by permission of the AAS.
0
1
2
3
4
5
1997
1999
2001
2003
2005
2007
2009
2011
Pressure (nPa)
Solar Wind Dynamic Pressure
-40%
96-97
(f)
0
5
10
15
(nT)
Magnetic Field Strength
-39%
(d)
0
5
10
1997
1999
2001
2003
2005
2007
2009
2011
Oxygen/(m
2
s)
1997-1998 Solar Min
21.8%
Cosmic Ray Oxygen
(176-238 MeV/nucleon)
Scaled
d
e
t
c
e
j
o
r
P
M
N
m
o
r
f
from NM
(a)
Figure 10-17