

82
M. C. Ben Nasr et al.
0
200
400
600
800
0
2
4
6
10
4
Normal breathing (C1)
0
200
400
600
800
Timestamp
0
2
4
10
4
Post cough breathing (C3)
0
100
200
300
400
500
0
5
10
10
4
Cough (C2)
0
200
400
600
800
Timestamp
4
4.5
5
5.5
10
4
Holding breath (C4)
0
200
400
600
800
1000
1200
1400
Timestamp
0
5
10
10
4
Mouvement (C6)
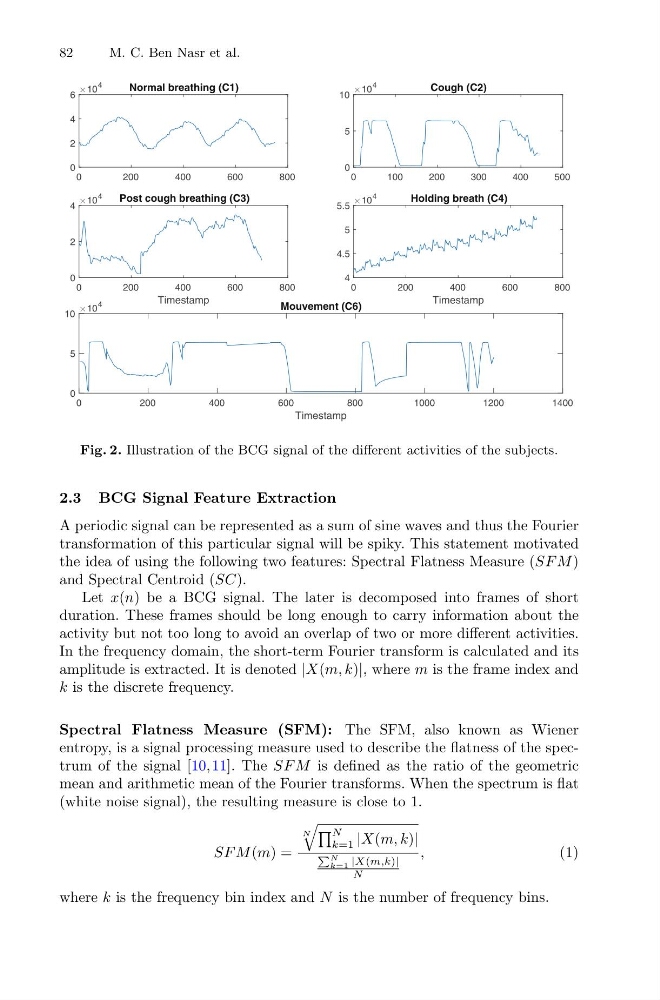
Fig. 2. Illustration of the BCG signal of the different activities of the subjects.
2.3 BCG Signal Feature Extraction
A periodic signal can be represented as a sum of sine waves and thus the Fourier
transformation of this particular signal will be spiky. This statement motivated
the idea of using the following two features: Spectral Flatness Measure (SF M )
and Spectral Centroid (SC).
Let x(n) be a BCG signal. The later is decomposed into frames of short
duration. These frames should be long enough to carry information about the
activity but not too long to avoid an overlap of two or more different activities.
In the frequency domain, the short-term Fourier transform is calculated and its
amplitude is extracted. It is denoted |X(m, k)|, where m is the frame index and
k is the discrete frequency.
Spectral Flatness Measure (SFM): The SFM, also known as Wiener
entropy, is a signal processing measure used to describe the flatness of the spectrum of the signal [10,11]. The SF M is defined as the ratio of the geometric
mean and arithmetic mean of the Fourier transforms. When the spectrum is flat
(white noise signal), the resulting measure is close to 1.
SF M (m) =
N
N
k=1 |X(m, k)|
N
k=1 |X(m,k)|
N
,
(1)
where k is the frequency bin index and N is the number of frequency bins.
M. C. Ben Nasr et al.
0
200
400
600
800
0
2
4
6
10
4
Normal breathing (C1)
0
200
400
600
800
Timestamp
0
2
4
10
4
Post cough breathing (C3)
0
100
200
300
400
500
0
5
10
10
4
Cough (C2)
0
200
400
600
800
Timestamp
4
4.5
5
5.5
10
4
Holding breath (C4)
0
200
400
600
800
1000
1200
1400
Timestamp
0
5
10
10
4
Mouvement (C6)
Fig. 2. Illustration of the BCG signal of the different activities of the subjects.
2.3 BCG Signal Feature Extraction
A periodic signal can be represented as a sum of sine waves and thus the Fourier
transformation of this particular signal will be spiky. This statement motivated
the idea of using the following two features: Spectral Flatness Measure (SF M )
and Spectral Centroid (SC).
Let x(n) be a BCG signal. The later is decomposed into frames of short
duration. These frames should be long enough to carry information about the
activity but not too long to avoid an overlap of two or more different activities.
In the frequency domain, the short-term Fourier transform is calculated and its
amplitude is extracted. It is denoted |X(m, k)|, where m is the frame index and
k is the discrete frequency.
Spectral Flatness Measure (SFM): The SFM, also known as Wiener
entropy, is a signal processing measure used to describe the flatness of the spectrum of the signal [10,11]. The SF M is defined as the ratio of the geometric
mean and arithmetic mean of the Fourier transforms. When the spectrum is flat
(white noise signal), the resulting measure is close to 1.
SF M (m) =
N
N
k=1 |X(m, k)|
N
k=1 |X(m,k)|
N
,
(1)
where k is the frequency bin index and N is the number of frequency bins.