

Respiratory Activity Classification
81
0
0.5
1
1.5
2
2.5
3
3.5
4
Timestamp
10 4
0
1
2
3
4
5
6
7
BCG signal
10 4
Normal Breathing (C1)
Cough (C2)
Post-Cough Breathing (C3)
Holding Breath (C4)
Expiration (C5)
Other (C7)
Movement (C6)
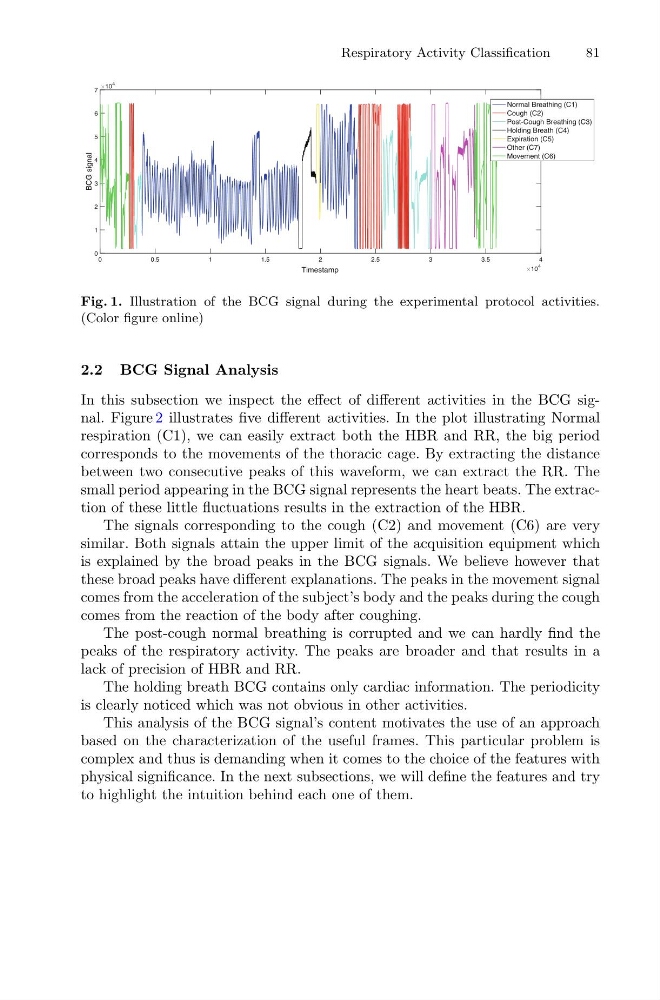
Fig. 1. Illustration of the BCG signal during the experimental protocol activities.
(Color figure online)
2.2 BCG Signal Analysis
In this subsection we inspect the effect of different activities in the BCG signal. Figure 2 illustrates five different activities. In the plot illustrating Normal
respiration (C1), we can easily extract both the HBR and RR, the big period
corresponds to the movements of the thoracic cage. By extracting the distance
between two consecutive peaks of this waveform, we can extract the RR. The
small period appearing in the BCG signal represents the heart beats. The extraction of these little fluctuations results in the extraction of the HBR.
The signals corresponding to the cough (C2) and movement (C6) are very
similar. Both signals attain the upper limit of the acquisition equipment which
is explained by the broad peaks in the BCG signals. We believe however that
these broad peaks have different explanations. The peaks in the movement signal
comes from the acceleration of the subject’s body and the peaks during the cough
comes from the reaction of the body after coughing.
The post-cough normal breathing is corrupted and we can hardly find the
peaks of the respiratory activity. The peaks are broader and that results in a
lack of precision of HBR and RR.
The holding breath BCG contains only cardiac information. The periodicity
is clearly noticed which was not obvious in other activities.
This analysis of the BCG signal’s content motivates the use of an approach
based on the characterization of the useful frames. This particular problem is
complex and thus is demanding when it comes to the choice of the features with
physical significance. In the next subsections, we will define the features and try
to highlight the intuition behind each one of them.
81
0
0.5
1
1.5
2
2.5
3
3.5
4
Timestamp
10 4
0
1
2
3
4
5
6
7
BCG signal
10 4
Normal Breathing (C1)
Cough (C2)
Post-Cough Breathing (C3)
Holding Breath (C4)
Expiration (C5)
Other (C7)
Movement (C6)
Fig. 1. Illustration of the BCG signal during the experimental protocol activities.
(Color figure online)
2.2 BCG Signal Analysis
In this subsection we inspect the effect of different activities in the BCG signal. Figure 2 illustrates five different activities. In the plot illustrating Normal
respiration (C1), we can easily extract both the HBR and RR, the big period
corresponds to the movements of the thoracic cage. By extracting the distance
between two consecutive peaks of this waveform, we can extract the RR. The
small period appearing in the BCG signal represents the heart beats. The extraction of these little fluctuations results in the extraction of the HBR.
The signals corresponding to the cough (C2) and movement (C6) are very
similar. Both signals attain the upper limit of the acquisition equipment which
is explained by the broad peaks in the BCG signals. We believe however that
these broad peaks have different explanations. The peaks in the movement signal
comes from the acceleration of the subject’s body and the peaks during the cough
comes from the reaction of the body after coughing.
The post-cough normal breathing is corrupted and we can hardly find the
peaks of the respiratory activity. The peaks are broader and that results in a
lack of precision of HBR and RR.
The holding breath BCG contains only cardiac information. The periodicity
is clearly noticed which was not obvious in other activities.
This analysis of the BCG signal’s content motivates the use of an approach
based on the characterization of the useful frames. This particular problem is
complex and thus is demanding when it comes to the choice of the features with
physical significance. In the next subsections, we will define the features and try
to highlight the intuition behind each one of them.