

EEG-Based Hypo-vigilance Detection Using Convolutional Neural Network
75
– Recorded data by 4 electrodes (T7, T8, O1 and O2) from temporal and occipital areas.
– Recorded data by 7 electrodes (AF3, F7, F3, T7, O2, P8, F8) from prefrontal
and occipital areas.
– Recorded data by 14 electrodes.
For the distribution of our data, we choose 70% for the train part and 30% for
the test. Table 2 presents the reported testing and training accuracy respectively
with two, four, seven and fourteen electrodes. After convergence the optimum
number of test epochs for all the different electrodes results establish a value
equal to 80. The best results are given by the recording of 2 electrodes from the
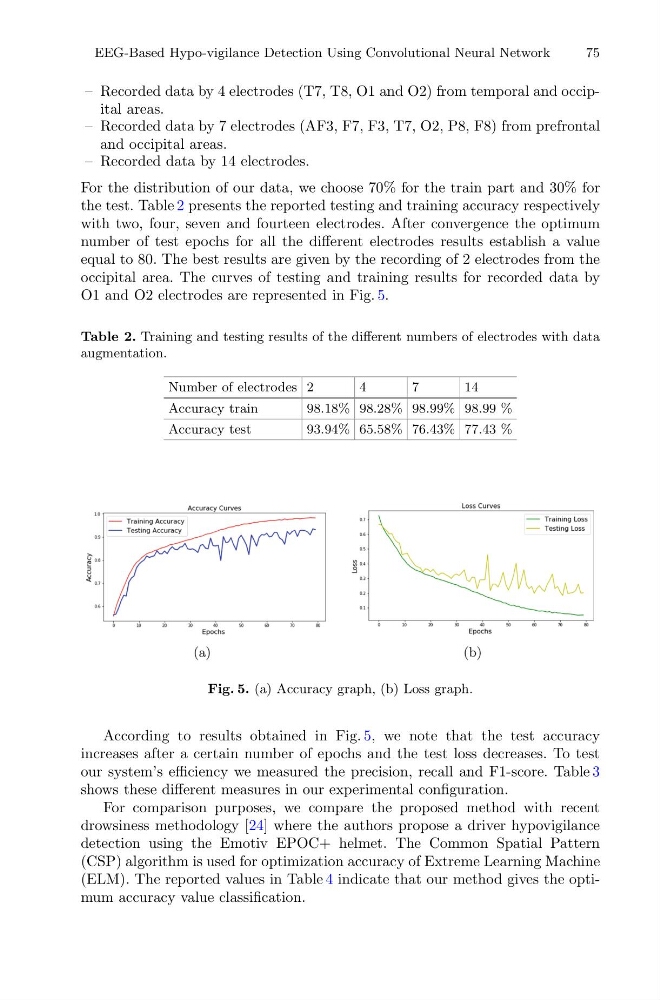
occipital area. The curves of testing and training results for recorded data by
O1 and O2 electrodes are represented in Fig. 5.
Table 2. Training and testing results of the different numbers of electrodes with data
augmentation.
Number of electrodes 2
4
7
14
Accuracy train
98.18% 98.28% 98.99% 98.99 %
Accuracy test
93.94% 65.58% 76.43% 77.43 %
Fig. 5. (a) Accuracy graph, (b) Loss graph.
According to results obtained in Fig. 5, we note that the test accuracy
increases after a certain number of epochs and the test loss decreases. To test
our system’s efficiency we measured the precision, recall and F1-score. Table 3
shows these different measures in our experimental configuration.
For comparison purposes, we compare the proposed method with recent
drowsiness methodology [24] where the authors propose a driver hypovigilance
detection using the Emotiv EPOC+ helmet. The Common Spatial Pattern
(CSP) algorithm is used for optimization accuracy of Extreme Learning Machine
(ELM). The reported values in Table 4 indicate that our method gives the optimum accuracy value classification.
75
– Recorded data by 4 electrodes (T7, T8, O1 and O2) from temporal and occipital areas.
– Recorded data by 7 electrodes (AF3, F7, F3, T7, O2, P8, F8) from prefrontal
and occipital areas.
– Recorded data by 14 electrodes.
For the distribution of our data, we choose 70% for the train part and 30% for
the test. Table 2 presents the reported testing and training accuracy respectively
with two, four, seven and fourteen electrodes. After convergence the optimum
number of test epochs for all the different electrodes results establish a value
equal to 80. The best results are given by the recording of 2 electrodes from the
occipital area. The curves of testing and training results for recorded data by
O1 and O2 electrodes are represented in Fig. 5.
Table 2. Training and testing results of the different numbers of electrodes with data
augmentation.
Number of electrodes 2
4
7
14
Accuracy train
98.18% 98.28% 98.99% 98.99 %
Accuracy test
93.94% 65.58% 76.43% 77.43 %
Fig. 5. (a) Accuracy graph, (b) Loss graph.
According to results obtained in Fig. 5, we note that the test accuracy
increases after a certain number of epochs and the test loss decreases. To test
our system’s efficiency we measured the precision, recall and F1-score. Table 3
shows these different measures in our experimental configuration.
For comparison purposes, we compare the proposed method with recent
drowsiness methodology [24] where the authors propose a driver hypovigilance
detection using the Emotiv EPOC+ helmet. The Common Spatial Pattern
(CSP) algorithm is used for optimization accuracy of Extreme Learning Machine
(ELM). The reported values in Table 4 indicate that our method gives the optimum accuracy value classification.