

70
A. Boudaya et al.
vision. Many studies [5–8] have been proposed to detect hypo-vigilance based
on biomedical signals such as electroencephalogram (EEG), electrocardiogram
(ECG), electromyogram (EMG), and electrooculogram (EOG). Given, its high
temporal resolution, portability and reasonable cost, the present work focus on
hypo-vigilance detection by analyzing EEG signal of various brain’s functionalities using fourteen electrodes placed on the participant’s scalp. On the other
hand, deep learning networks offer great potential for biomedical signals analysis
through the simplification of raw input signals (i.e., through various steps including feature extraction, denoising and feature selection) and the improvement of
the classification results.
In this paper, we focus on the EEG signal study recorded by fourteen electrodes for hypo-vigilance detection by analyzing the various functionalities of
the brain from the electrodes placed on the participant’s scalp.
Various deep learning architectures [9] exist such as Convolutional Neural
Network (CNN), Recurrent CNN (R-CNN), Auto-Encoder (AE), Deep Belief
Network (DBN), including Long Short-Term Memory (LSTM) and Gated Recurrent Units (GRU). As in [10], the CNN architecture is the most used to biomedical signals analysis providing a high classification accuracy. Previous related
work [11] proposes a hypo-vigilance detection method using CNN by facial features. This method showed a classification accuracy of 92.33%. Likewise [12],
introduces an adaptive conditional representation learning system for driver
drowsiness detection based on a 3D-CNN. The proposed system consists of four
steps (spatio-temporal representation, data preprocessing, features combination
and somnolence detection). The experimental results show a detection accuracy
equal to 92.04%. In this paper, we propose a CNN hypo-vigilance detection
method using EEG data in order to classify drowsiness and awakeness states.
Accordingly, the proposed approach including used equipment are presented in
Sect. 2. Section 3 describes the experimental results and the evaluation of the
employed method. Finally, a conclusion and future work are drawn in Sect. 4.
2 Proposed Approach
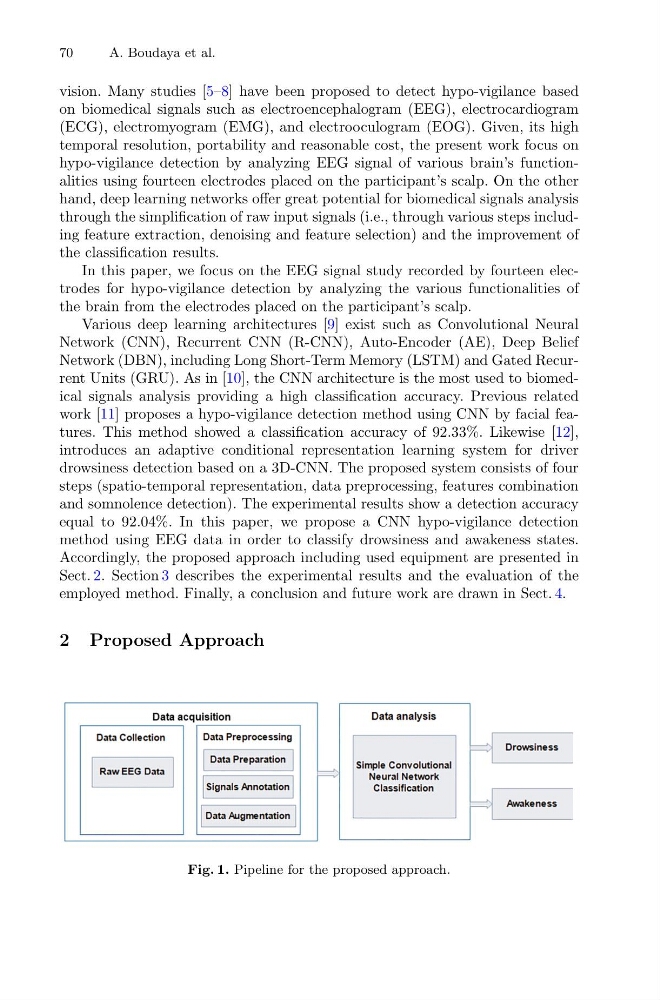
Fig. 1. Pipeline for the proposed approach.
A. Boudaya et al.
vision. Many studies [5–8] have been proposed to detect hypo-vigilance based
on biomedical signals such as electroencephalogram (EEG), electrocardiogram
(ECG), electromyogram (EMG), and electrooculogram (EOG). Given, its high
temporal resolution, portability and reasonable cost, the present work focus on
hypo-vigilance detection by analyzing EEG signal of various brain’s functionalities using fourteen electrodes placed on the participant’s scalp. On the other
hand, deep learning networks offer great potential for biomedical signals analysis
through the simplification of raw input signals (i.e., through various steps including feature extraction, denoising and feature selection) and the improvement of
the classification results.
In this paper, we focus on the EEG signal study recorded by fourteen electrodes for hypo-vigilance detection by analyzing the various functionalities of
the brain from the electrodes placed on the participant’s scalp.
Various deep learning architectures [9] exist such as Convolutional Neural
Network (CNN), Recurrent CNN (R-CNN), Auto-Encoder (AE), Deep Belief
Network (DBN), including Long Short-Term Memory (LSTM) and Gated Recurrent Units (GRU). As in [10], the CNN architecture is the most used to biomedical signals analysis providing a high classification accuracy. Previous related
work [11] proposes a hypo-vigilance detection method using CNN by facial features. This method showed a classification accuracy of 92.33%. Likewise [12],
introduces an adaptive conditional representation learning system for driver
drowsiness detection based on a 3D-CNN. The proposed system consists of four
steps (spatio-temporal representation, data preprocessing, features combination
and somnolence detection). The experimental results show a detection accuracy
equal to 92.04%. In this paper, we propose a CNN hypo-vigilance detection
method using EEG data in order to classify drowsiness and awakeness states.
Accordingly, the proposed approach including used equipment are presented in
Sect. 2. Section 3 describes the experimental results and the evaluation of the
employed method. Finally, a conclusion and future work are drawn in Sect. 4.
2 Proposed Approach
Fig. 1. Pipeline for the proposed approach.